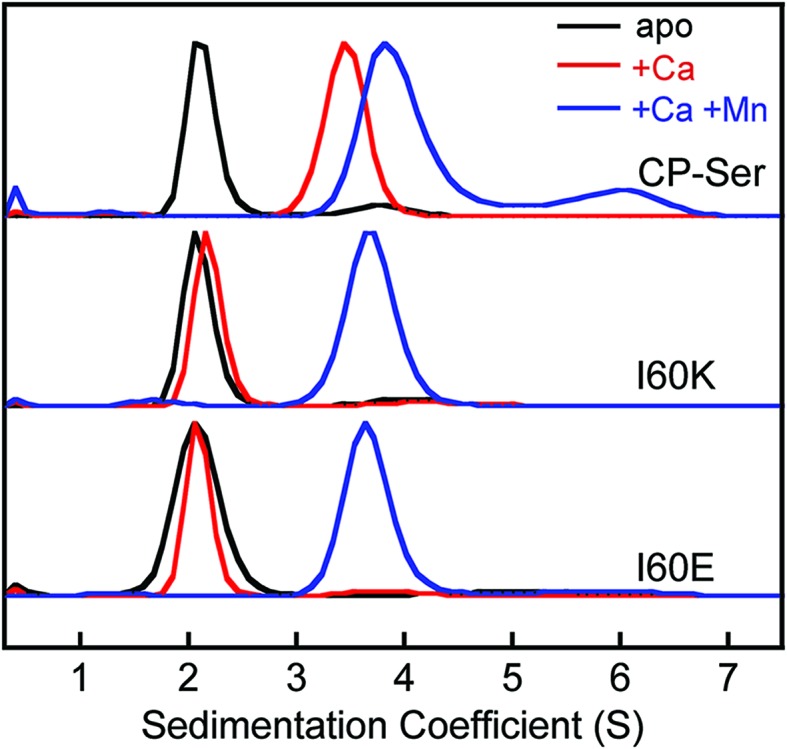
Fig. 3. Sedimentation distributions of CP-Ser, I60E, and I60K (27.5 μM) obtained with the c(s) model in SEDFIT (75 mM HEPES, 100 mM NaCl, pH 7.5, 20 °C). Black traces, no metal added. The CP-Ser sample included 550 μM EDTA. Red traces, 550 μM of Ca(ii) in the sample. Blue traces, 550 μM Ca(ii) and 27.5 μM Mn(ii) in the sample. Each sedimentation distribution is normalized to the maximum c(s).