. 2015 Nov 10;7(2):989–994. doi: 10.1039/c5sc03417e

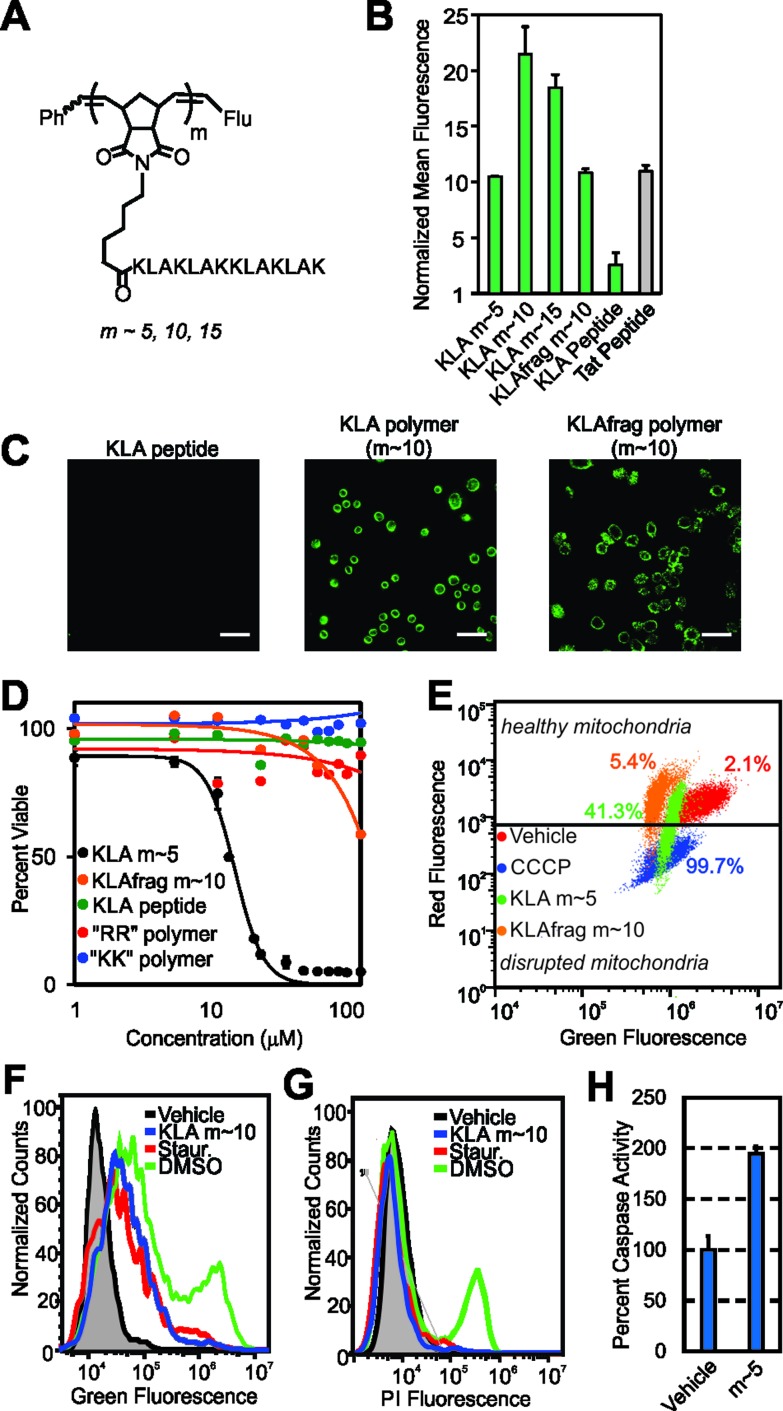
Fig. 3. Cellular internalization and bioactivity of KLA peptide homopolymers. (A) Chemical structure of the homopolymers. “Flu” is the fluorescein end-label shown in Fig. 1A. (B) Flow cytometry data showing fluorescent signatures of HeLa cells treated with the KLA polymers and peptide. Data is normalized to DPBS at a value of 1. (C) Live-cell confocal microscopy images showing average intensities from six consecutive 1 μm slices of HeLa cells treated with the KLA peptide or polymer (m ∼ 10). Scale bars are 50 μm. (D) Viability of cells treated with KLA polymers (m ∼ 5), the KLAfragment polymer (m ∼ 10), GSGSGRR polymer (m ∼ 60), GSGSGKK polymer (m ∼ 60) and the KLA peptide. LD50 values for the KLA polymers, obtained by fitting data to the Hill equation, are 12.5, 25, and 30 μM for the m ∼ 5, 10 and 15 polymers, respectively. Note that the dose–response curves for the m ∼ 10 and 15 KLA polymers are provided in Fig. S18. (E) Mitochondrial membrane potential disruption assays. The percentages given describe the percent of signal resulting from each material in the disrupted mitochondria region. (F) Annexin V cell staining assay to identify apoptotic cells. A rightward population shift is indicative of an increase in apoptotic cells. Staurosporine (Staur.) is a known positive control for apoptosis and behaves identically to the KLA polymer in this assay (∼5-fold increase). (G) Propidium iodide cell staining assay for the identification of necrotic cells. DMSO-treated cells show a ∼40-fold increase in necrotic cells, as indicated by an increase in fluorescence of a cell population, whereas KLA polymer and staurosporine-treated cells show no shift.

Fig. 3