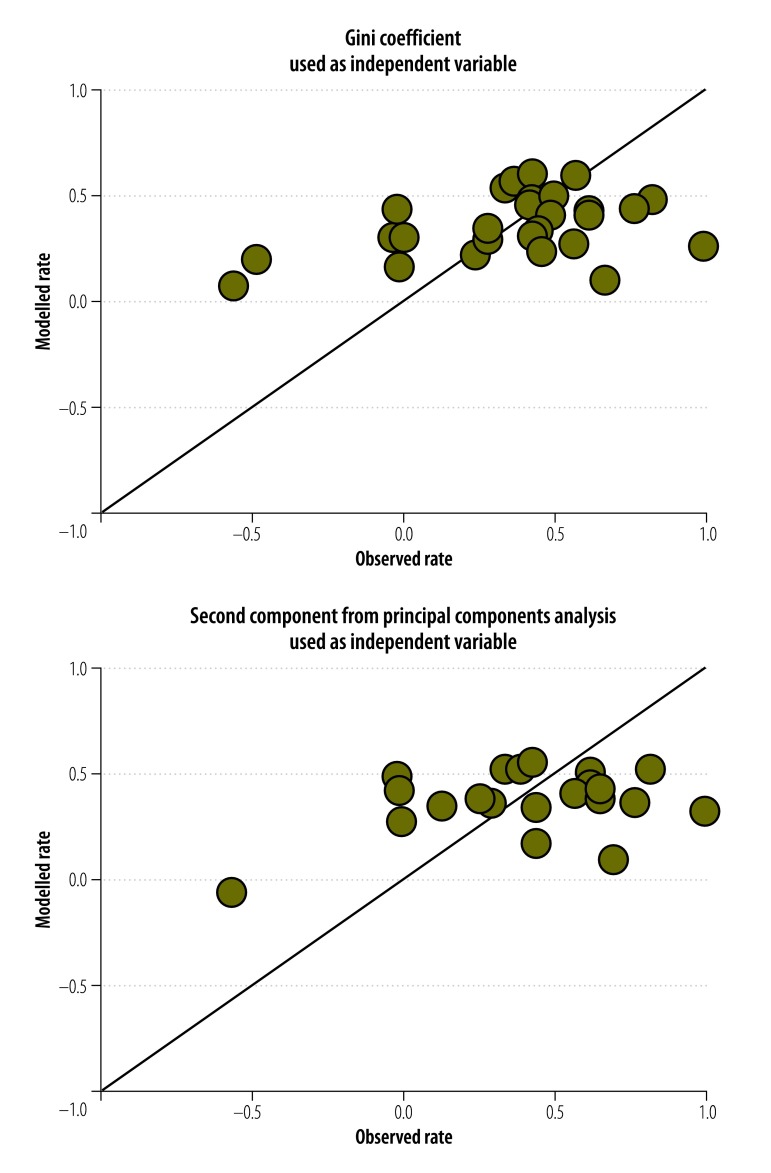
Fig. 3.
Observed and modelled normalized rates of change in access to drinking water in 27 countries with no armed conflict, 2000–2012
Notes: The plots show estimates from linear regressions, with either the Gini coefficient or the second component from principal components analysis used as the independent variable. The solid lines indicate a perfect match between the observed rates and the modelled estimates.

