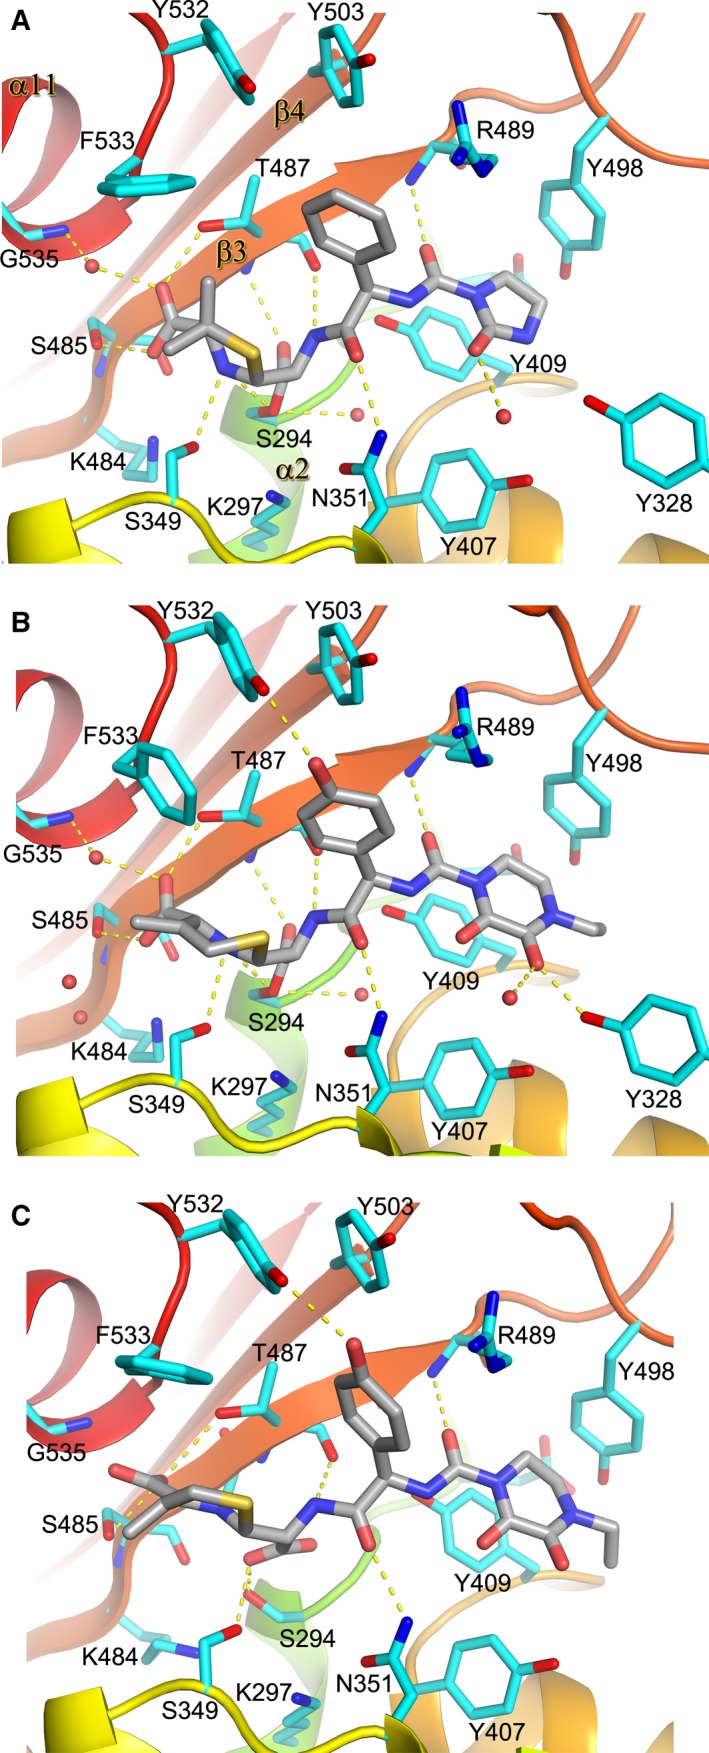
Figure 3.

Details of protein‐inhibitor interactions. (A) azlocillin and (B) cefoperazone PBP3 covalent complexes, (C) PBP3–anhydrodesacetyl cephalosporoic (ACA) noncovalent complex. The protein backbone is shown as ribbons in rainbow colours from the N to C terminus. Key protein side‐chains are drawn as cyan sticks. The antibiotics are shown as grey sticks with nitrogen atoms in blue, oxygen atoms in red and sulfur atoms in yellow. The red spheres are water molecules. Potential hydrogen bonds are indicated by yellow dashed lines.
