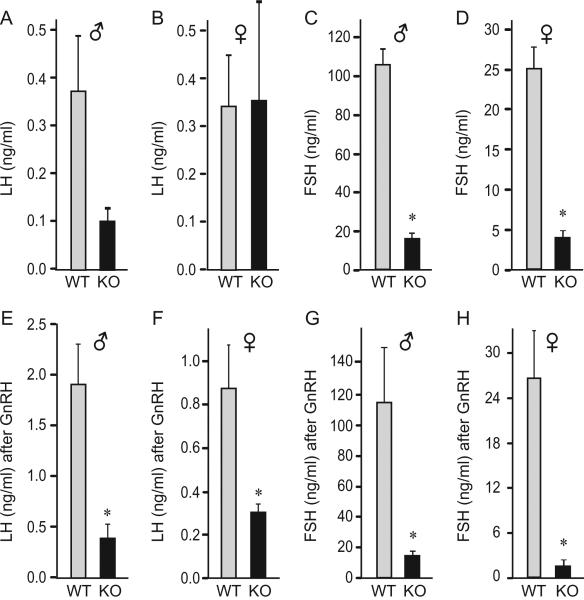
Fig. 2.
Circulatory levels of gonadotropin hormones. A–D, Gonadotropin hormone levels in serum from the p35 day old animals, 5 per group, presented as the mean ± SEM. E–H, Animals were injected subcutaneously with 200 ng/kg GnRH and blood was collected 10 minutes post injection. Asterisks (*) indicate significant difference, p < 0.05, in the levels between cFOS-null animals and the wild-type animals.

