
Figure 1. Visualizing Transcription of a Developmental Gene in Living Cells.
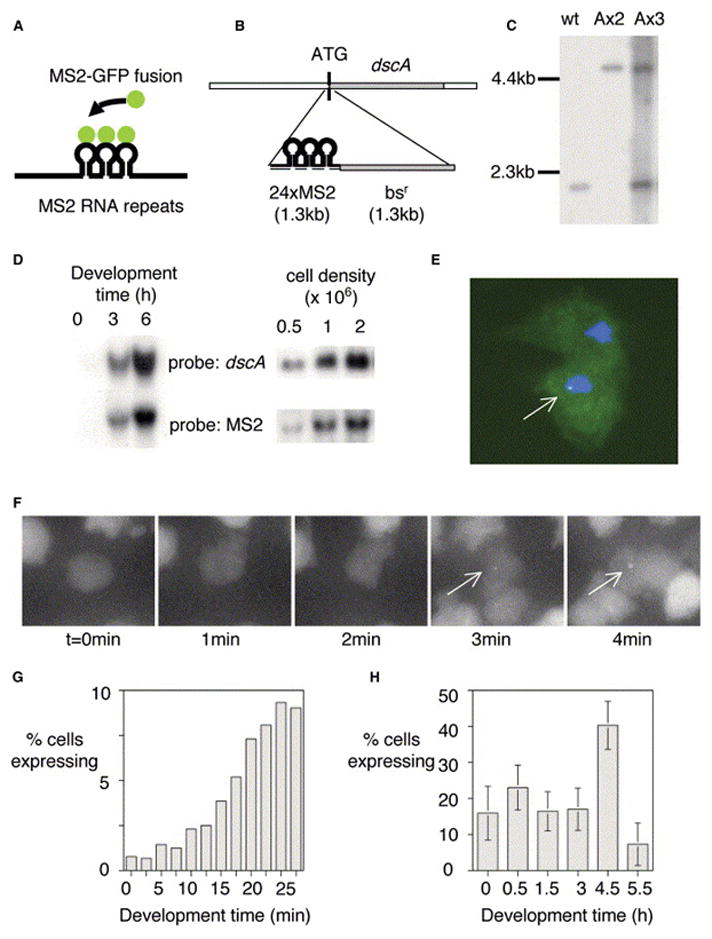
(A) Schematic for RNA detection system.
(B) Schematic for detection of expression of dscA gene.
(C) Southern analysis of dscA-MS2 knockin cell lines. Extra wild-type band for AX3 corresponds to wild-type gene on duplicated portion of chromosome 2.
(D) Northern analysis of dscA-MS2 cells demonstrating appropriate induction by starvation (left) and high culture density during growth (right). The MS2 RNA runs as a single major band at 1.5 kb.
(E) Transformation of MS2-GFP into dscA-MS2 cells reveals a single nuclear spot in expressing cells (arrow).
(F) Visualizing the induction of dscA transcription (arrows, maximal projection of 3D stacks).
(G) Increase in the proportion of expressing cells during the first 30 min of differentiation.
(H) Developmental variation in the proportion of expressing cells. Data are from 30 min movies commencing at the indicated times. 30–40 movies (n = 1500–2000 cells) were collected over 3–4 experimental days for each time point (bars indicate standard deviation).