
Figure 2. Variation in the Length of Transcriptional Pulses.
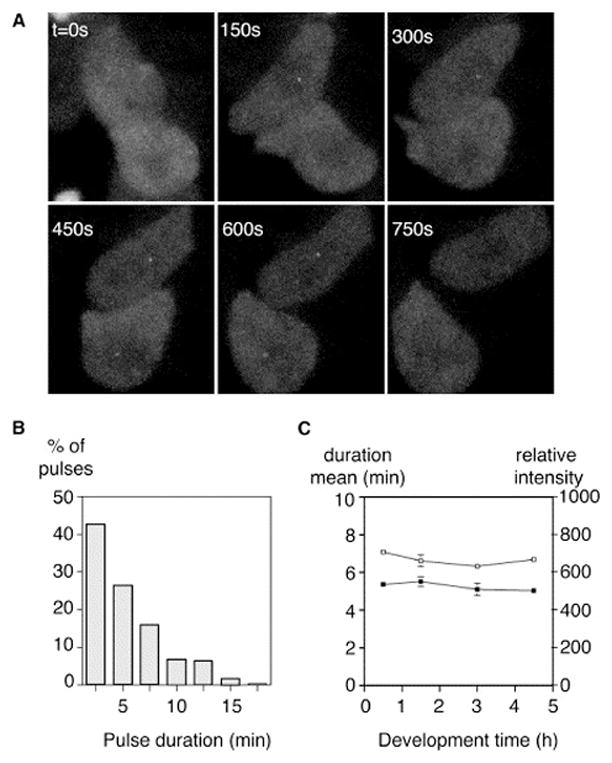
(A) Variation in pulse duration. The top cell has a visible transcriptional event for 4 frames (10 min), whereas the neighboring lower cell expresses for only 2 frames (maximal projection).
(B) Distribution of pulse durations for the 0.5 hr time point. Shorter pulses are more common.
(C) Developmental profile of mean pulse duration (filled symbols) and intensity (open symbols). Pulse duration and intensity are not subject to major developmental variation (bars reflect standard error).