
Figure 4. Expression of dscA in Cell Clusters.
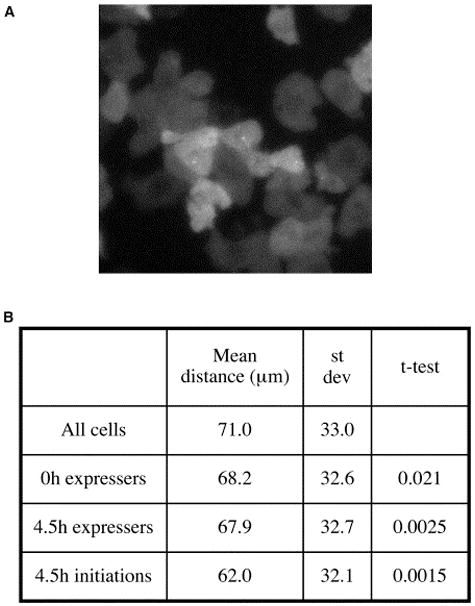
(A) Example image of the expression of dscA restricted to neighboring cells (maximal projection).
(B) Significant clustering of dscA expressers. Pairwise distances between all transcription sites in a field were compared with pairwise distances between the centroids of all the cells (>105total cell:cell comparisons) in a field. These data were analyzed from cells at the onset of differentiation (0 hr) and preaggregation (4.5 hr). Most significant clustering was detected when only the initiating frame of the pulse was used, suggestive of coordinated transcription induction.