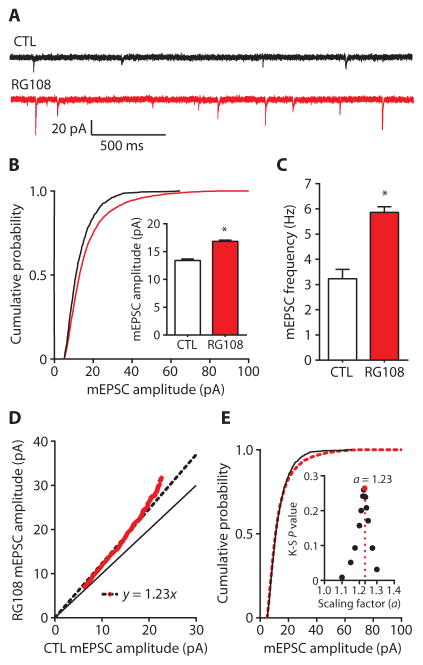
Fig. 2. DNMT inhibition with RG108 multiplicatively upscales excitatory strength.
(A) Sample mEPSC records from cortical pyramidal neurons after 24-hour treatment with control (CTL) or RG108 (red). (B and C) Cumulative probability distributions and mean mEPSC amplitudes (B) and mean mEPSC frequencies (C) from cortical pyramidal neurons treated with RG108. Bar graphs are means ± SEM from cells pooled from at least four experiments for each condition (CTL, n = 12 cells; RG108, n = 12 cells). (B) P < 0.001, K-S test. Inset: *P < 0.001, M-W test. (C) *P < 0.05, Student’s unpaired t test. (D) Rank order plot of 1000 randomly selected mEPSC amplitudes from CTL and RG108-treated cells (red values). Fitting the data with y = ax yielded a scaling factor of 1.23, which was used to scale down amplitudes from RG108-treated cells in (B). (E) Cumulative probability distributions of scaled-down RG108-induced amplitudes compared to those from CTL cells. P = 0.2645, K-S test. Inset: Testing a range of scaling factors (a) between 1.1 and 1.3 revealed that RG108-induced amplitudes from (B) scaled down with a = 1.23 resulted in the highest K-S P value (0.2645) (red dot) compared to CTL.

