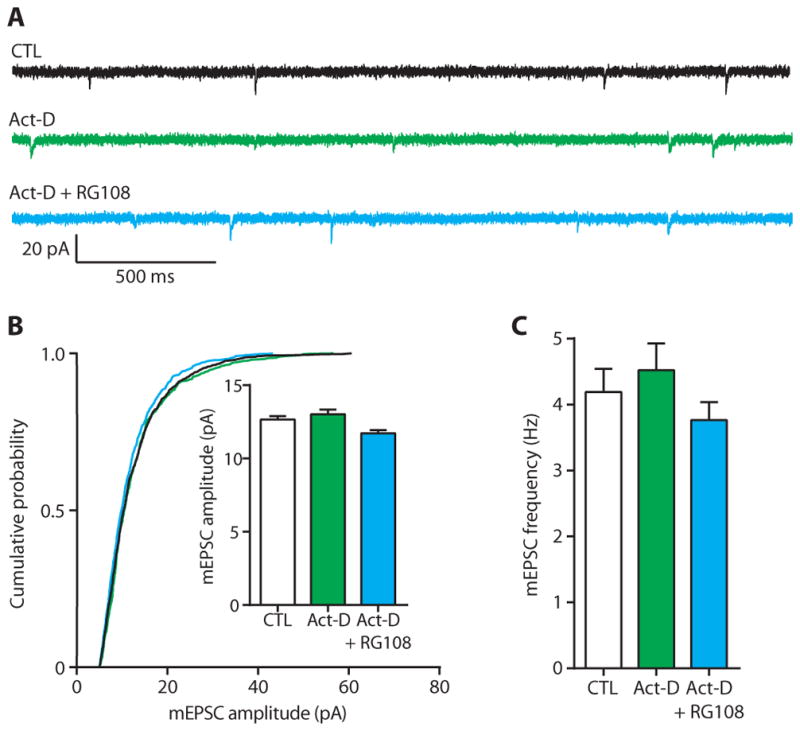
Fig. 4. Transcription inhibition blocks the effect of chronic inhibition of DNA methylation on excitatory transmission.

(A) Sample mEPSC traces from cortical pyramidal neurons after 24-hour exposure to control (CTL), actinomycin D (Act-D; green), or Act-D + RG108 (blue). (B and C) Cumulative probability distributions and mean mEPSC amplitudes (B) and mean mEPSC frequencies (C) in cortical pyramidal neurons treated with Act-D alone or co-incubation with RG108. Bar graphs are means ± SEM. Data are cumulative of cells pooled from at least three experiments for each condition (CTL, n = 9 cells; Act-D, n = 4 cells; Act-D + RG108, n = 7 cells). (B) K-W test, P = 0.0059. (C) ANOVA, P = 0.3439.
