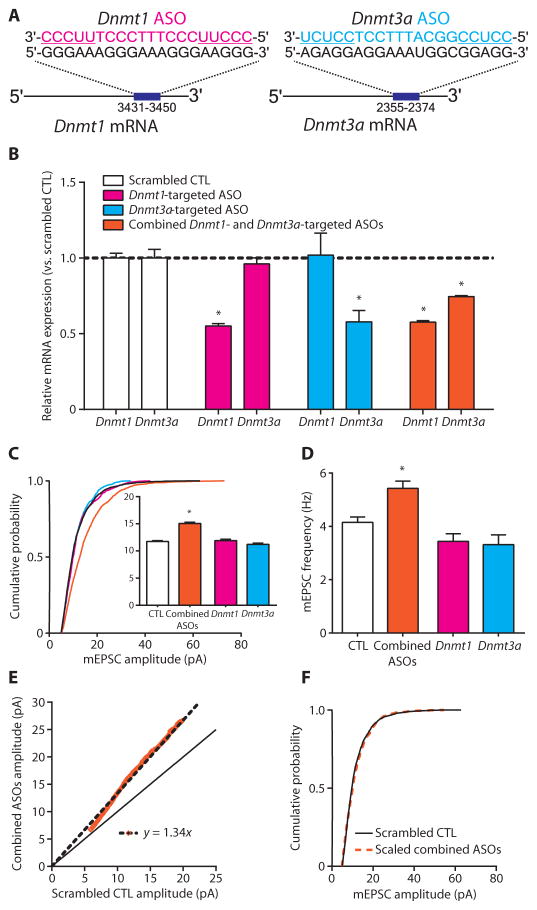
Fig. 5. Combined Dnmt1 and Dnmt3a knockdown multiplicatively upscales excitatory strength.
(A) Depiction of ASO base pairing with target Dnmt mRNA. ASO-binding positions are listed under the target transcript. Underlined ASO sequences represent 2′-OMe–modified nucleotide wings. (B) Bar graphs show relative expression of Dnmt1 and Dnmt3a mRNA after ASO treatment. Data are means ± SEM from three experiments; *P < 0.05 compared to scrambled CTL, ANOVA followed by Dunnett’s test. (C and D) Cumulative probability distributions and mean mEPSC amplitudes (C) and mean mEPSC frequencies (D) in cortical pyramidal neurons treated with Dnmt-targeted ASOs. Bar graphs are means ± SEM. Data are cumulative of cells pooled from at least two experiments for each condition (scrambled CTL, n=16 cells; combined ASOs, n=8 cells; Dnmt1 ASO, n= 5 cells; and Dnmt3a ASO, n= 5 cells). (C) *P< 0.001 compared to scrambled CTL, K-W test followed by Dunn’s test. (D) *P<0.05 compared to scrambled CTL, ANOVA followed by Dunnett’s test. (E) Rank order plot of 1000 randomly selected mEPSC amplitudes from scrambled CTL and combined ASO treatment (orange values). Linear regression yielded a scaling factor of 1.34, which was used to scale down amplitudes from combined ASO-treated cells from (C). (F) Scaled-down amplitudes from combined ASO-treated cells compared to those in scrambled CTL cells; P = 0.1323 compared to scrambled CTL, K-S test.

