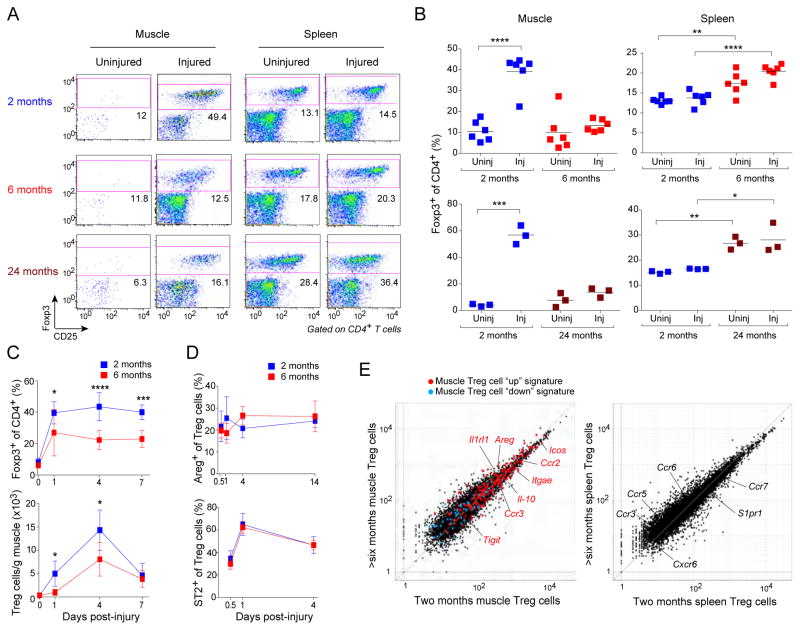
Figure 1. Diminished Treg cell accumulation in skeletal muscle of aged mice.
Different-aged B6 mice were im-injected with CTX into the hindlimb muscles. A. Cytofluorometric dot-plots of lymphocytes taken 6 days after injury. Representative of n=3–6 mice. Numbers depict the fraction of CD4+ T cells within the designated gate. B. Summary data for the experiments depicted in panel A. C. Summary data on Treg cell fraction (top) and number (bottom) various days after injury. n=4–9. D. Summary data on muscle Treg cell diagnostic marker expression over time. n=4 mice. E. RNAseq analysis. Normalized expression values for muscle (left) and splenic (right) Treg cells isolated 4 days after CTX injury. Muscle Treg cell “up” (red) and “down” (blue) signature transcripts (Burzyn et al., 2013) are overlain in the left panel, with some key muscle Treg cell “up” genes highlighted. Some differentially expressed genes encoding trafficking or related molecules are highlighted on the spleen plot in the right panel. Averaged from two experiments. For all relevant panels: mean ± SD. *, p≤.05; **, p≤.01; ***, p≤.001; ****, p .0001 from the unpaired t-test corrected for multiple experiments. Post-test comparisons of ranked p-values (generated from Fisher's Least Significant Difference test) using the Holm-Sidlac method. Significance level set at 5%. All other p-values were not significant. (See also Fig. S1.)

