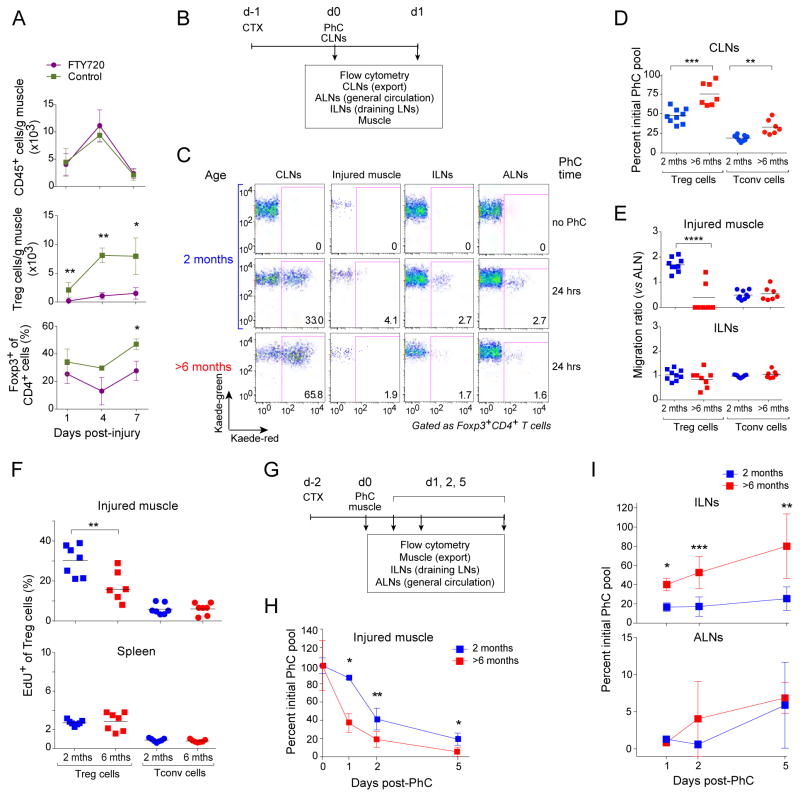
Figure 2. Defects in Treg cell recruitment, proliferation, and retention in muscle of aged mice.
A. Muscle Treg cell dependence on the circulating pool. Two-month-old mice were treated with FTY720 or PBS a day prior to CTX-induced injury and daily thereafter, and muscle lymphocytes were analyzed cytofluorometrically various days later. n=3–8 mice. B–E. Treg cell migration from the CLNs to the muscle. B. Schematic diagram of the protocol. Two-month-- or >6-month-old Kaede/B6 Tg mice were injected with CTX, and 24 hours later, the CLNs (cervical LNs) were exposed to violet light non-invasively. Lymphocytes from the indicated tissues were examined cytofluorometrically for Kaede-red+ photoconverted (PhC) cells, either immediately or 24 hours later (ALNs= axial LNs, ILNs= inguinal LNs). C) Dot-plot representative of n=7–9 mice from three experiments. D) Exodus from the PhC CLN pool. Normalized to the day 0 PhC population. E) Immigration to various tissues. The “migration ratio” is the fraction of Kaede-red+ cells in a designated organ normalized to the fraction in the non-draining LN, which provides a measure of the systemic circulation. Raw fractional data appear in Fig. S2A. F) Muscle Treg cell proliferation. EdU was co-injected at the time of CTX injury, and LNs from the indicated tissues were examined cytofluorometrically a day later. n=7 mice from two experiments. Representative dot-plots can be found in Fig. S2B. G–I. Treg cell migration out of the muscle. G) Schematic diagram of the protocol. As per panels B–D, except that the tibialis anterior muscle was exposed to violet light two days after CTX injection, and tissues were examined 1–5 days later. H) Emigration of the initial PhC pool from the muscle. n=2–9 mice from three experiments. Normalized to the day 0 PhC population. I) Immigration of the initial PhC pool to draining and non-draining LNs. Normalized to the day 0 PhC value. Values ≥100% likely reflect proliferation. Statistics for this figure as per Fig. 1. (See also Fig. S2.)

