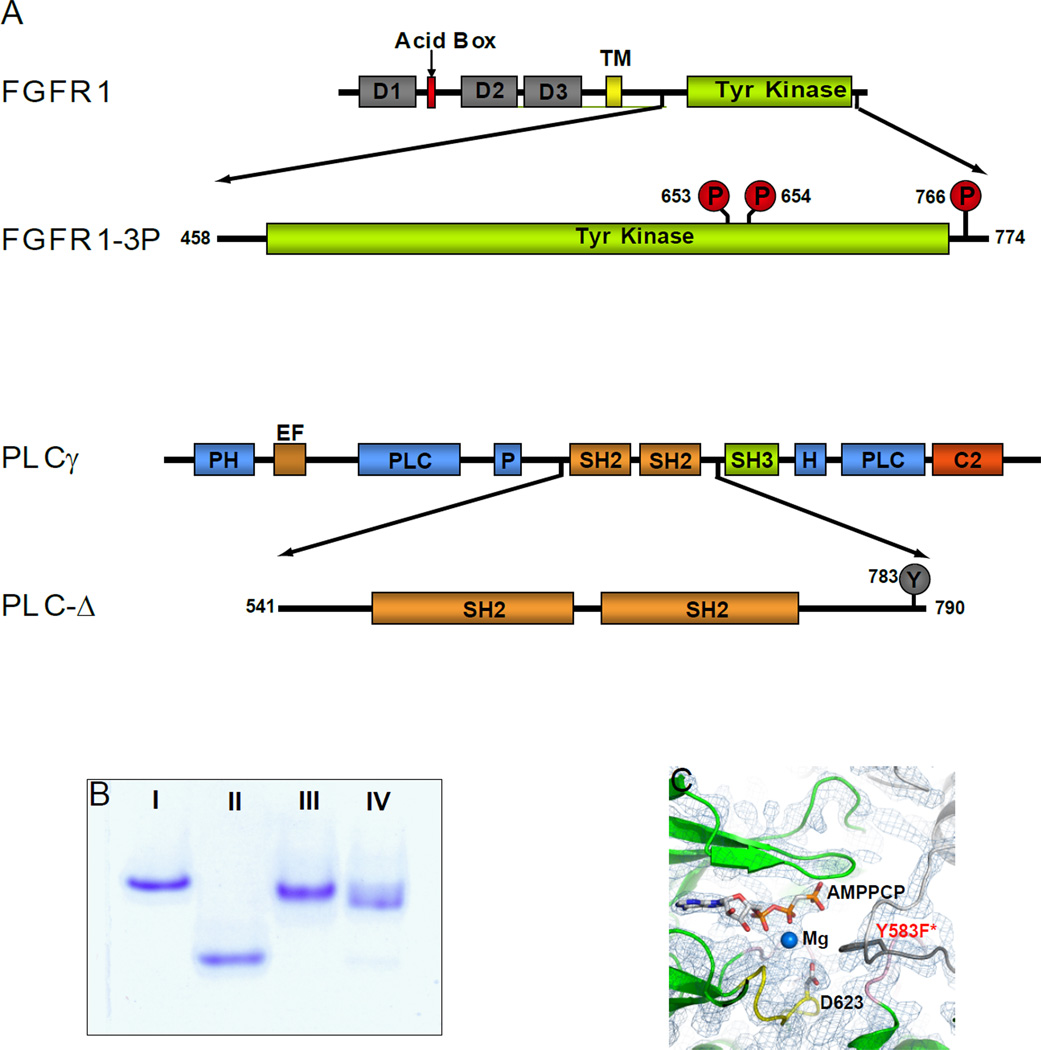
Figure 1. Schematic representation of FGFR1-3P and PLC-Δ.
(A) Schematic representation of wild type FGFR1 and PLCγ as well as their fragments FGFR1-3P and PLC-Δ that were studied in this manuscript. Phosphorylated tyrosine residues are marked by red circles and an unphosphorylated tyrosine by a grey circle. D1, 2 and 3 are Ig-like domains 1, 2 and 3 respectively. TM is transmembrane, PH pleckstrin homology, EF elongation factor, and C2 calcium/lipid-binding domains. (B) Coomassie blue stained native gels (7 %) of purified preparations of unphosphorylated FGFR1 (I), FGFR1-3P (II), PLC-Δ (III) and FGFR1-3P/PLC-Δ complex (IV). (C) The 2Fo-Fc map of AMP-PCP and surrounding kinase region. Ribbon diagrams of FGFR1-3P and the kinase insert region from a symmetry related molecule are shown in green and gray, respectively. AMP-PCP, catalytic base (D623) and the putative substrate (Y583F*; labeled in red) are depicted in a stick representation. Mg ion is shown as a blue sphere.

