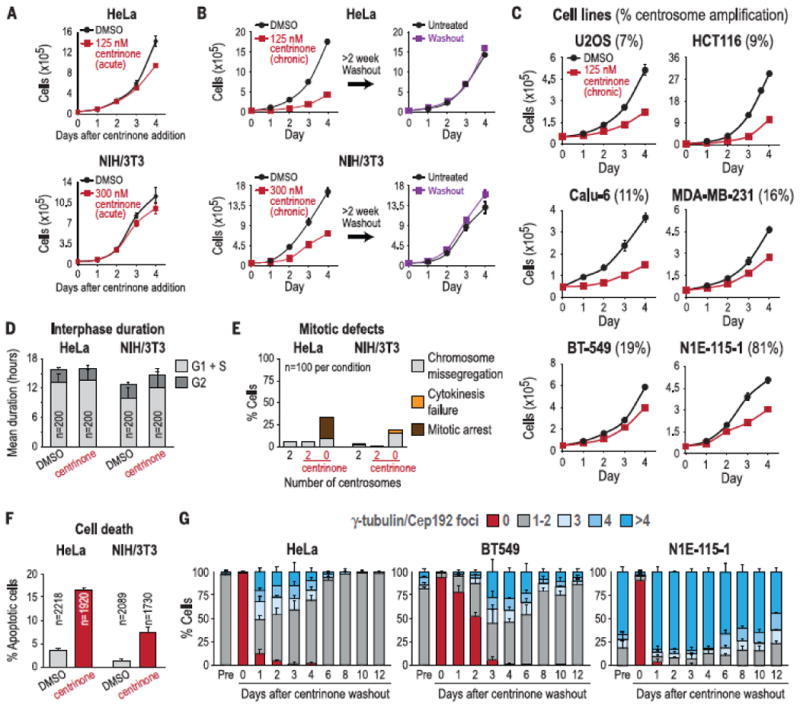
Fig. 2.

Transformed cells proliferate indefinitely in the absence of centrosomes. (A) Proliferation curves of HeLa and NIH/3T3 cells immediately after addition of centrinone or DMSO (control). (B) Proliferation curves after chronic (>2 weeks) centrinone treatment (left), or after chronic centrinone treatment followed by drug washout for >2 weeks (right). (C) Proliferation curves after chronic (>2 weeks) centrinone treatment in cell lines with varying degrees of centrosome amplification. Numbers in parentheses are percentages of cells exhibiting centrosome amplification in untreated population. Data in (A) to (C) are means T SEM (N = 3). (D) G1+S and G2 durations measured in HeLa and NIH/3T3 cells coexpressing GFP-PCNA and H2B-RFP (see fig. S6). Data are means T SD. (E) Percentage of cells exhibiting mitotic defects measured in HeLa and NIH/3T3 cells coexpressing centrin-GFP and H2B-RFP (see fig. S7). (F) Percentage of cells undergoing cell death in HeLa and NIH/3T3 cells, measured by using a fluorescent caspase substrate. Data are means T SD (N = 2). (G) Graphs showing centrosome number distribution over time after centrinone washout from HeLa, BT-549, and N1E-115-1 cells treated long-term (>2 weeks). The centrosome number distribution in untreated cells (“Pre” bars) is also shown for each cell line. Data are means T SD (N = 3).
