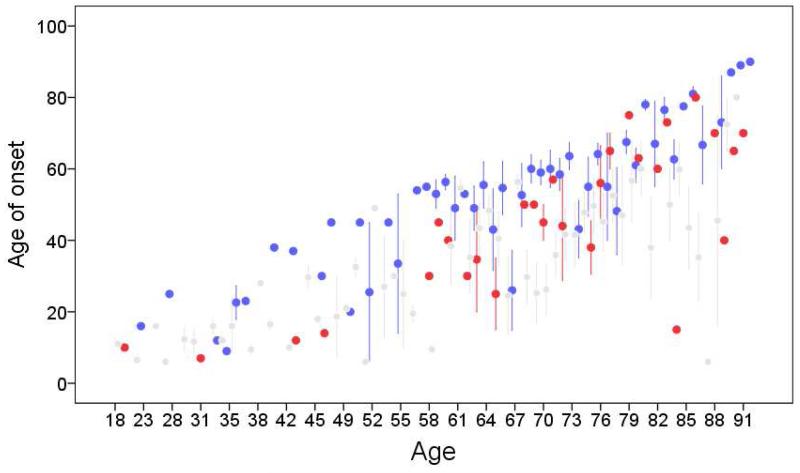
Figure 3.
Current age in years (x axis) by age of onset in years (y axis). Red circles are ETF cases whose affected relatives are in the same generation or in a younger generation than the proband. Gray circles are ETF cases whose affected relatives are in preceding generations. Blue circles are ETS cases (blue circles). Circles represent means and each bar represents 1 standard error.

