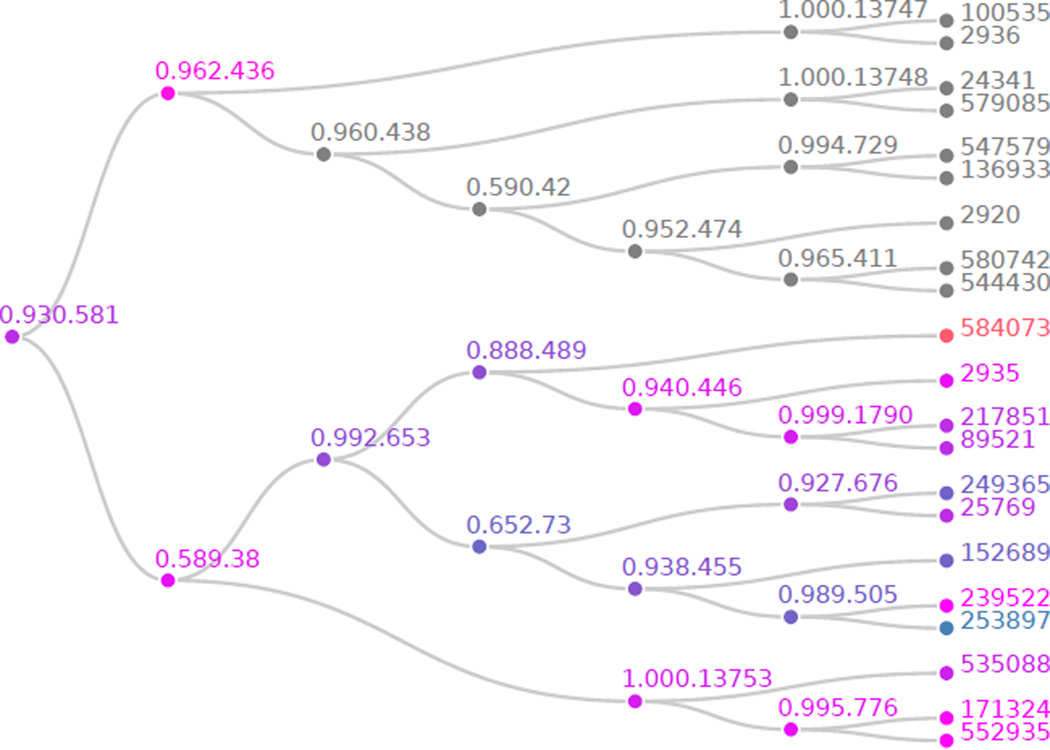
Figure 3.
Differential microbial abundance hypotheses tree p values after HFDR adjustment. The tip labels are OTU IDs, the internal node labels are common ancestors in the associated phylogenetic tree. The shade of any particular node corresponds to the outcome of the associated hypothesis test when considered independently of all other tests. Those hypotheses that are blue, magenta, or orange, have p values below, at or above α = 0.10, the threshold for each BH application to sibling pairs.

