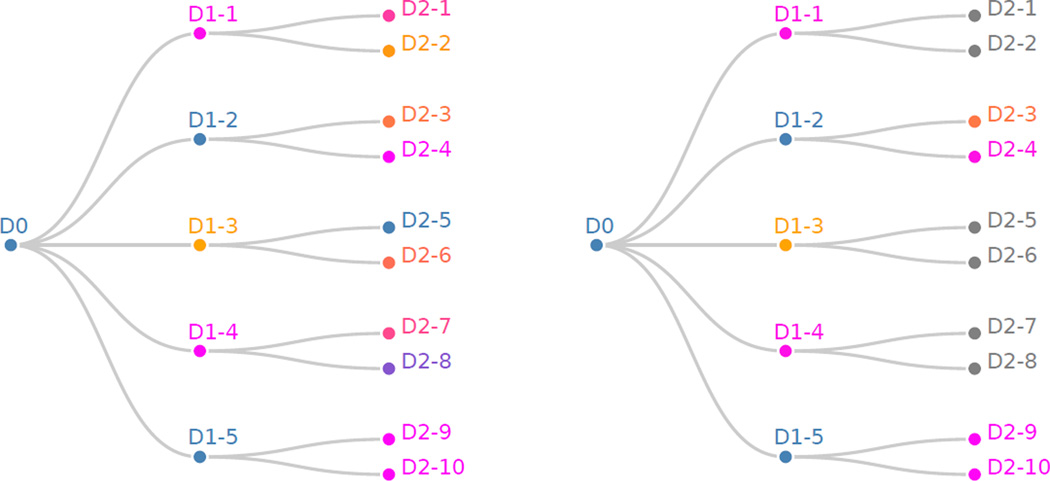
Figure 6.
Left: Hypotheses tree p values for the global temperature data before HFDR adjustment is performed. Nodes closer to the root represent the test for a trend at a larger time scale, while nodes closer to the base test for trends within time subsets. Right: HFDR adjustment applied to global temperature time series.

