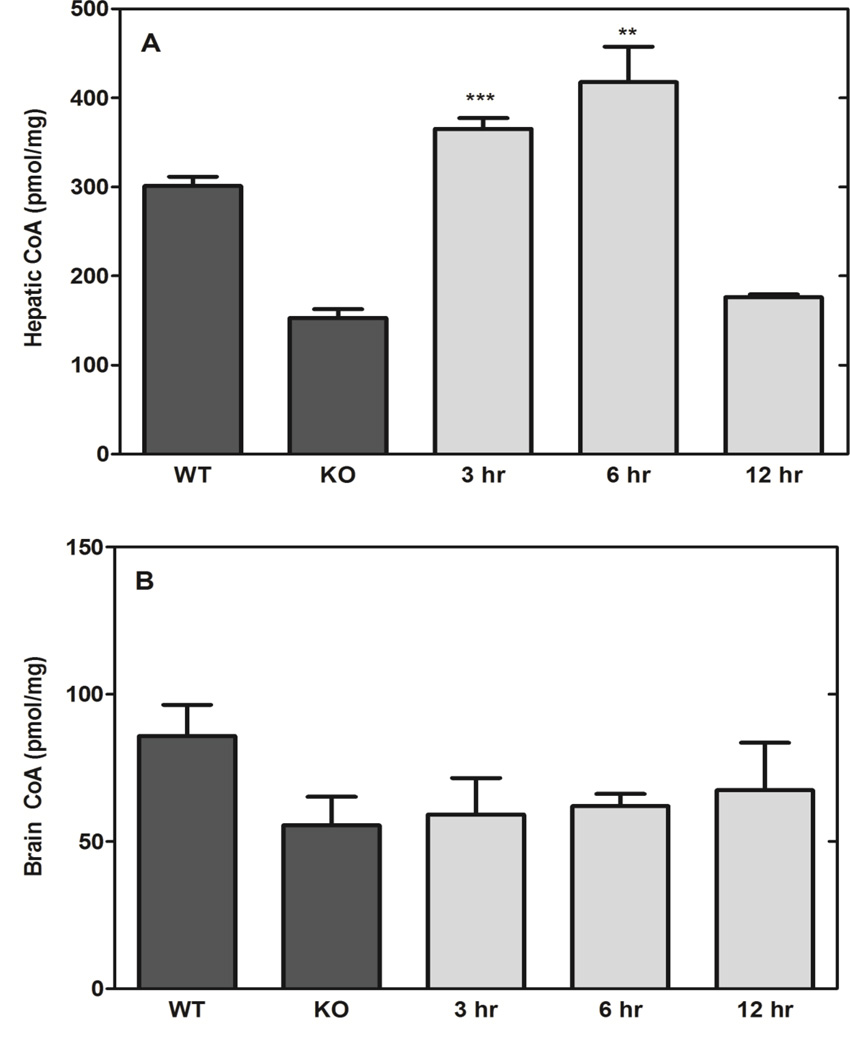
Fig. 7.
Response durability. A. Liver CoA. B. Brain CoA. Compound 2 (1.2 µmoles/g body weight; 569 mg/kg) was administered IP to Pank1−/− mice and tissues were isolated at the indicated times after treatment (n=3 per group). Statistically significant differences with respect to knockout (KO) values are presented as: * p<0.05; ** p<0.005; *** p<0.0005.

