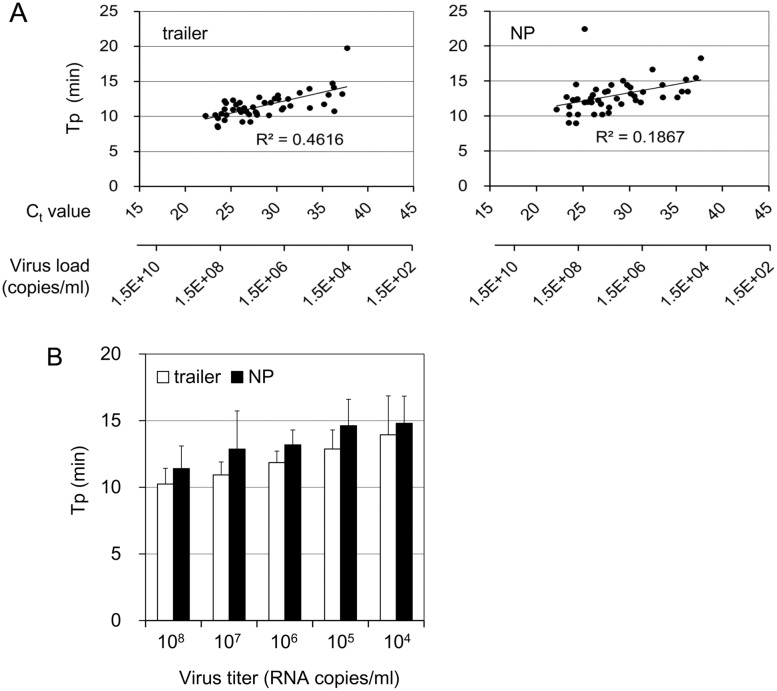
Fig 1. Detection time of EBOV RNA from the clinical samples with the RT-LAMP assay.
(A) Tp of respective samples determined by RT-LAMP test with primers for trailer and NP were plotted against Ct value determined with the reference rRT-PCR test. The virus load of each sample determined by Ct value is indicated on the lower x-axis. (B) Mean times of detection of each group with indicated virus load were determined. White and black bars indicate the results of RT-LAMP with primers specific for trailer and NP, respectively (mean ± standard deviation).

