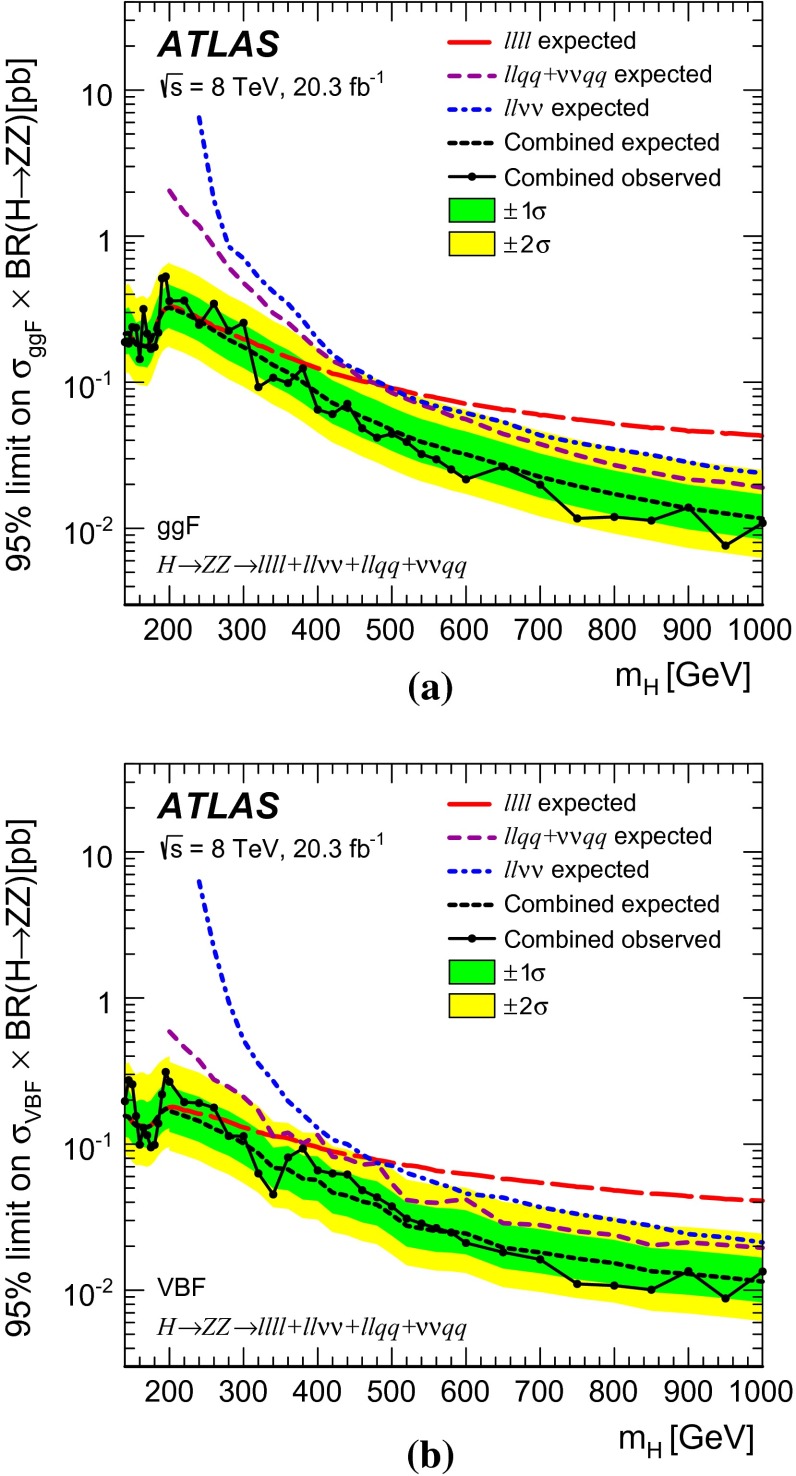
Fig. 12.
95 % CL upper limits on as a function of , resulting from the combination of all of the searches in the a ggF and b VBF channels. The solid black line and points indicate the observed limit. The dashed black line indicates the expected limit and the bands the 1- and 2- uncertainty ranges about the expected limit. The dashed coloured lines indicate the expected limits obtained from the individual searches; for the and searches, only the combination of the two is shown as they share control regions

