Figure 1.
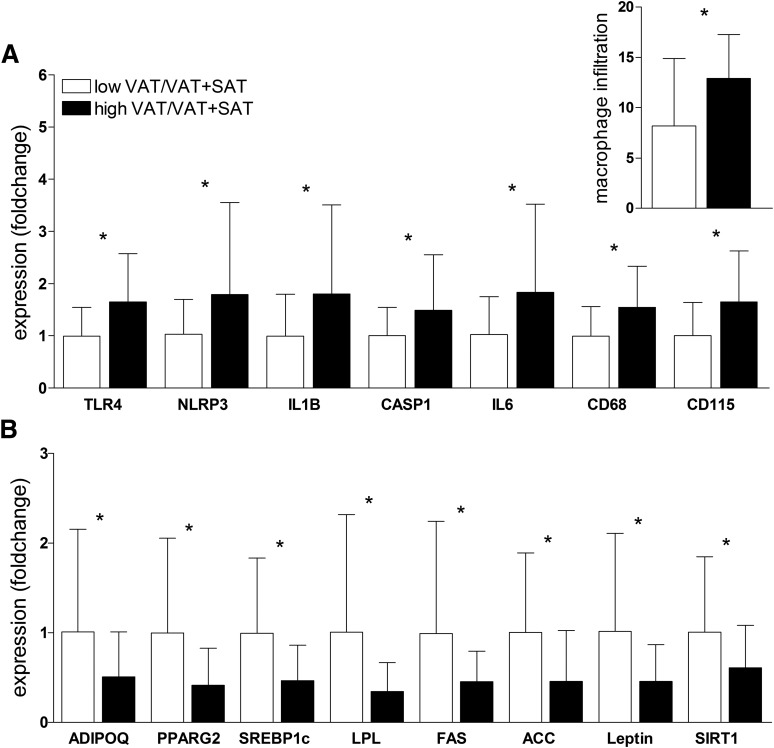
A: Increased inflammatory gene expression and macrophage infiltration in abdominal SAT of the high VAT/VAT+SAT group. B: Decreased lipogenic gene expression in abdominal SAT of the high VAT/VAT+SAT group. Subcutaneous expression of specific genes was normalized to the expression of 18S ribosomal RNA and based on the expression of a human control adipose tissue (2ΔΔCt). Expression values of the low VAT/VAT+SAT group (white bars) were set to 1, and values for the high VAT/VAT+SAT group (black bars) are expressed as fold changes compared with 1 (mean ± SD, n = 58). Macrophage infiltration (inset in A) was assessed by immunohistochemistry. *Indicates that the t test between the two groups was significant at the <0.05 level.

