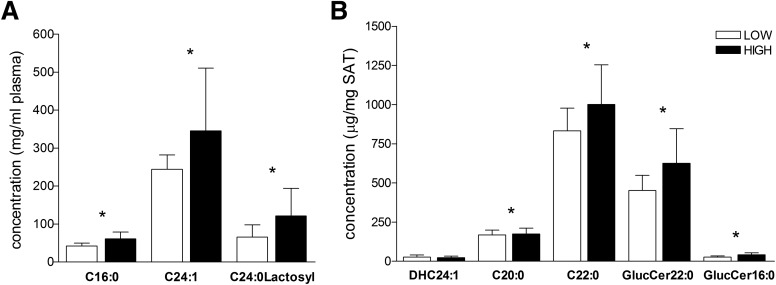
Figure 3.
Ceramide level in abdominal SAT of obese adolescents. A: Level of plasma ceramides is significantly different between low ratio (white bars, n = 4) and high ratio (black bars, n = 17) group (mean ± SD). *Indicates that the t test between the two groups was significant at the <0.05 level. B: Level of tissue ceramides is significantly different between low ratio (white bars, n = 27) and high ratio (black bars, n = 17) groups (mean ± SD). *Indicates that the t test between the two groups was significant at the <0.05 level.

