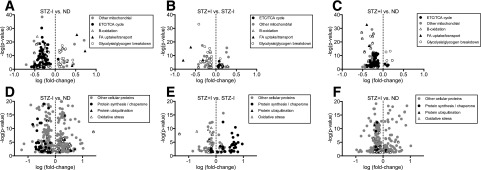
Figure 2.
The effect of insulin deprivation and treatment on skeletal muscle proteome. A: Compared with ND, STZ–I exhibited reduced expression of mitochondrial proteins but increased proteins linked with FA uptake/transport and glycolysis/glycogen breakdown. These directional trends were reversed in STZ+I (B) but were still visible compared with ND (C). D: Protein markers of oxidative stress and ubiquitination were higher in STZ–I mice compared with ND, and proteins linked with protein synthesis were lower. These directional trends were reversed in STZ+I (E) to the levels comparable with ND mice (F). Only significantly affected proteins are shown on volcano plots (–log10 P > 1.301). Individual protein names and expression values are given in Supplementary Table 2A–F for panels A to F, respectively.

