Figure 3.
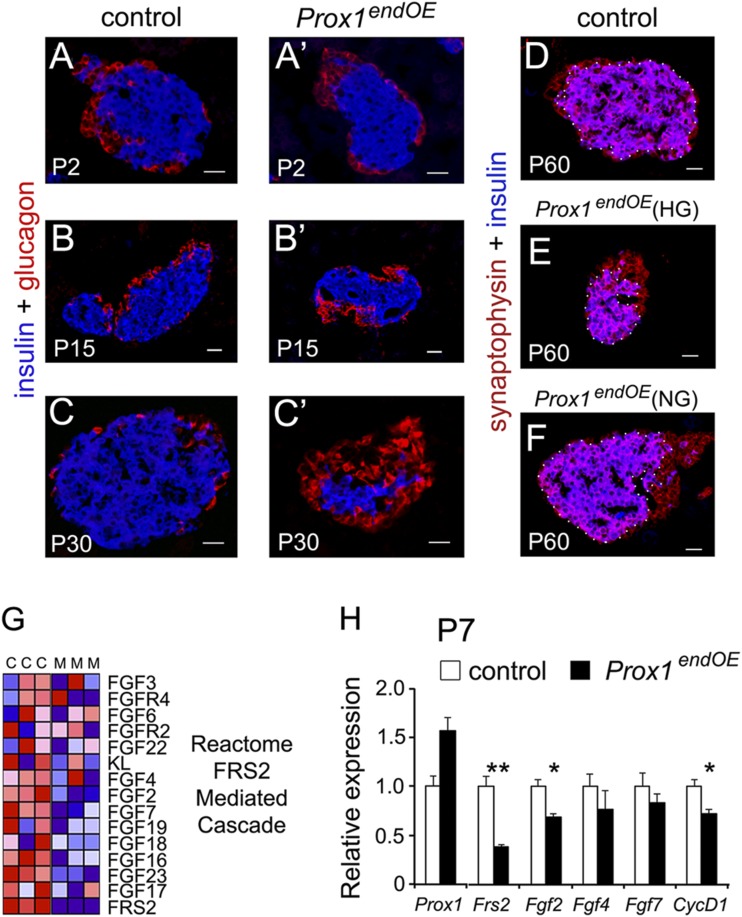
Prox1endOE(HG) adult mice exhibit islet hypoplasia. A–C and A′–C′: Immunostaining for insulin (blue) and glucagon (red) showing that the mass of β-cells decreases after P2 in pancreatic specimens from Prox1endOE mice. C′ is an islet of a Prox1endOE(HG) mouse. Immunostaining for the pan-islet marker synaptophysin (red) and insulin (blue) showing that at P60, the sizes of islets from control (D) and Prox1endOE(NG) (F) mice are comparable and the size of islets of Prox1endOE(HG) mice is abnormally small (E). The white dots demarcate the insulin-positive area. G: Heat map representation of transcripts involved in FGF signaling that were consistently decreased in Prox1endOE pancreata at P15. “C” and “M” are control (Neurog3-Cre) and Prox1endOE triplicates. H: qPCR analysis showed that Frs2, Fgf2, and CycD1 transcripts were significantly decreased in Prox1endOE pancreata at P7 (tissues from litters of parents that consistently produced only hyperglycemic transgenic offspring were used for these experiments). Data represent the mean (±SEM) of three independent experiments. *P < 0.05; **P < 0.01. Scale bars: 25 μm.

