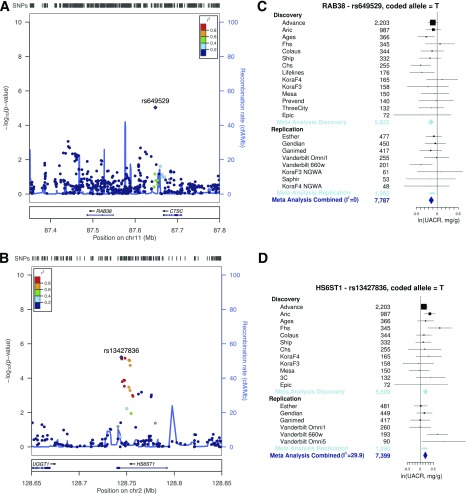
Figure 1.
Overview of associated genomic loci at RAB38/CTSC and HS6ST1 and consistent association with albuminuria in diabetes across the contributing studies. A: Regional association plot of the RAB38/CTSC locus on chromosome 11. B: The T allele at rs649529 is associated with lower UACR across discovery and replication studies. C: Regional association plot of the HS6ST1 locus on chromosome 10. D: The T allele of intronic rs13427836 is associated with higher UACR across discovery and replication studies. The solid squares indicate the mean difference and are proportional to the weights used in the meta-analysis. The solid vertical line indicates no effect. The diamond indicates the weighted mean difference, and the lateral tips of the diamond indicate the associated CIs. The horizontal lines represent the 95% CI.

