
Figure 2.
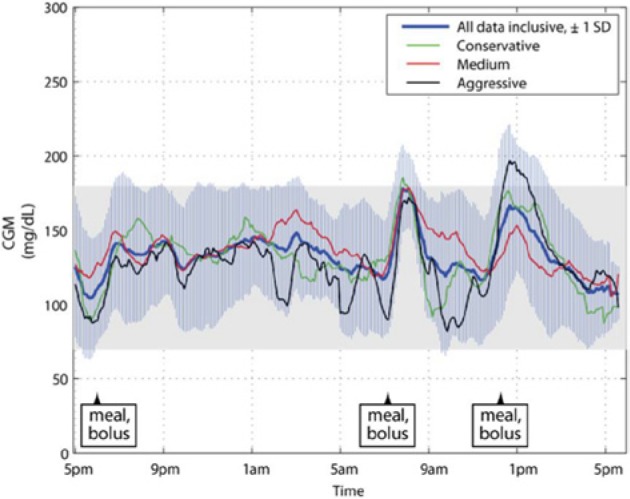
Mean CGM tracings of all patient clinic visits during closed-loop control, plotted inclusively and by aggressiveness factor subcohort. Also shown is the ±1 SD envelope around the mean tracing for the entire cohort. CGM, continuous glucose monitor; SD, standard deviation.