
Figure 3.
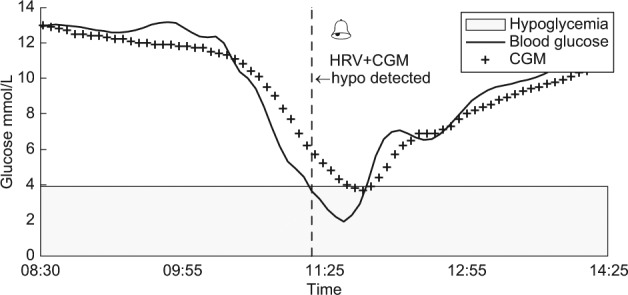
Glucose levels represented for 1 patient with a hypoglycemic episode by blood glucose levels (solid curve) and corresponding CGM (++ curve). The CGM alone detects the episode late after the onset, while the CGM+HRV algorithm detects the episode close to the onset (algorithm detection represented by the vertical dotted line marked “hypo detected”). CGM, continuous glucose monitoring; HRV, heart rate variability.