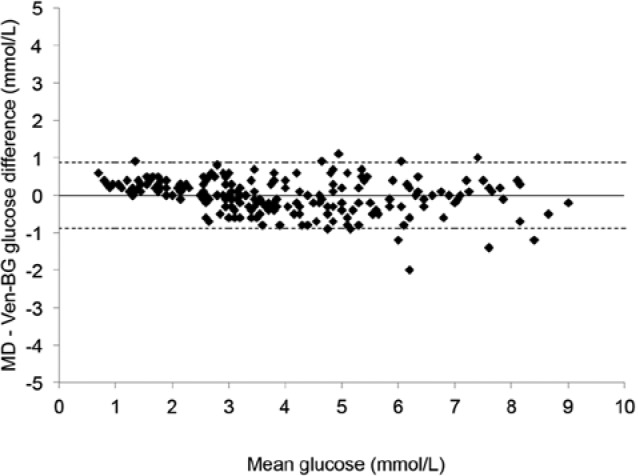
Figure 3.

Bland–Altman analysis of microdialysis glucose values with reference venous blood gas glucose values, plotting the difference between the 2 methods against the mean glucose value. The straight line represents bias (mean difference), and the dotted lines represent lines of agreement (± 1.96 SD). MD, microdialysis glucose value from triple-lumen catheter in superior vena cava position; Ven-BG, venous blood gas.
