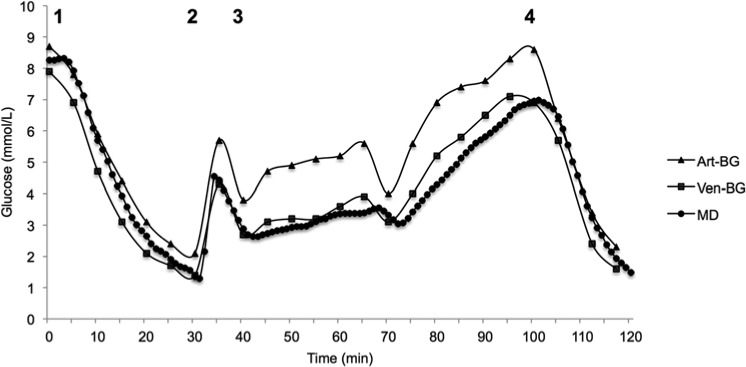
Figure 4.
Graph displaying the different blood glucose concentrations from 1 animal over time during the experiment. Arterial blood gas glucose values are higher during glucose administration (numbers in the figure represent the different study phases as described in Figure 1). Art-BG, arterial blood gas; MD, microdialysis glucose value from triple-lumen catheter in superior vena cava position; Ven-BG, venous blood gas.

