Table 4.
Construction of the Reduced Dynamic Envelope.
| S1 (I) (September 23) | 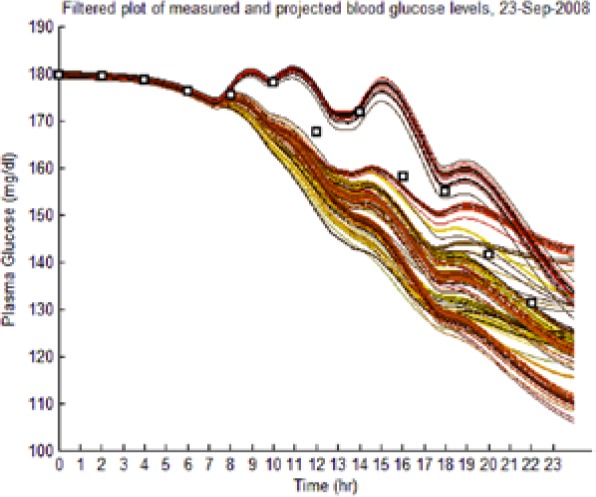 |
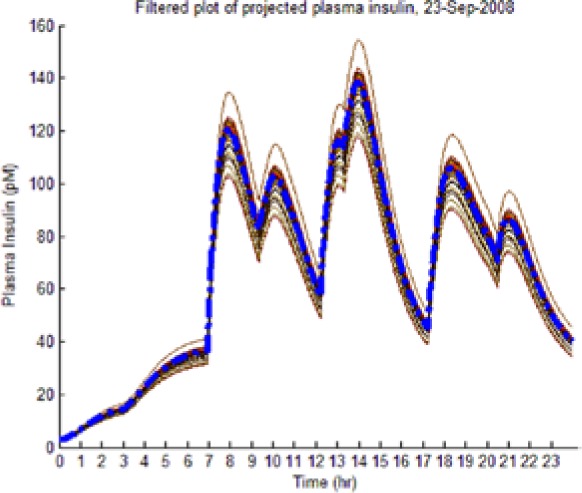 |
| S1 (No I) (September 23) | 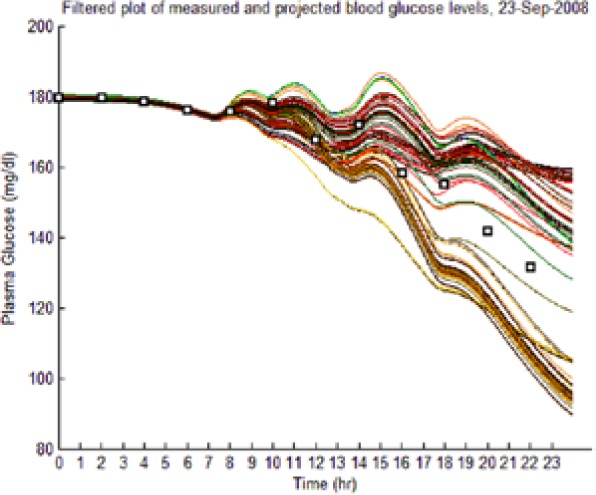 |
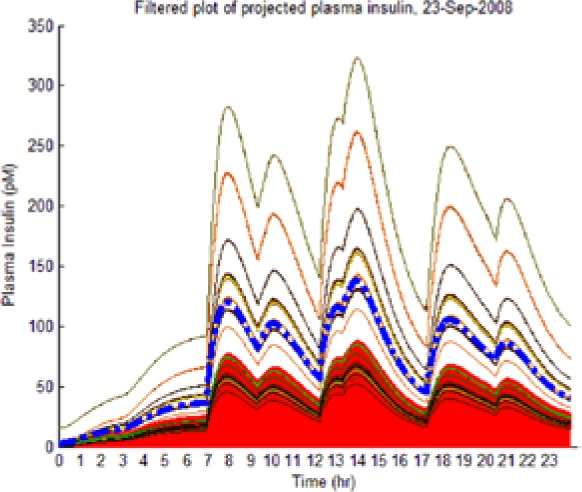 |
| S2 (I) (September 23) | 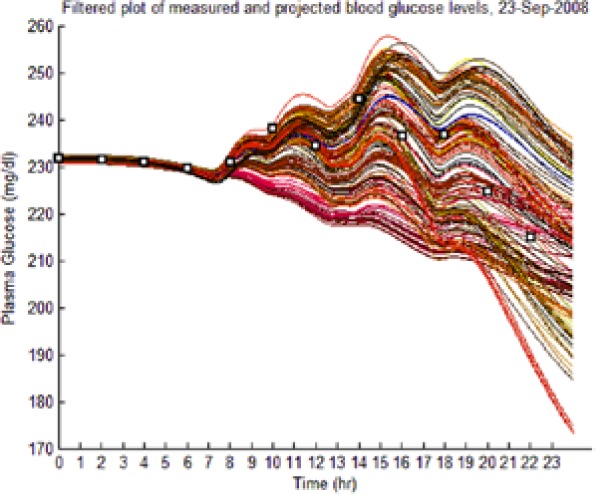 |
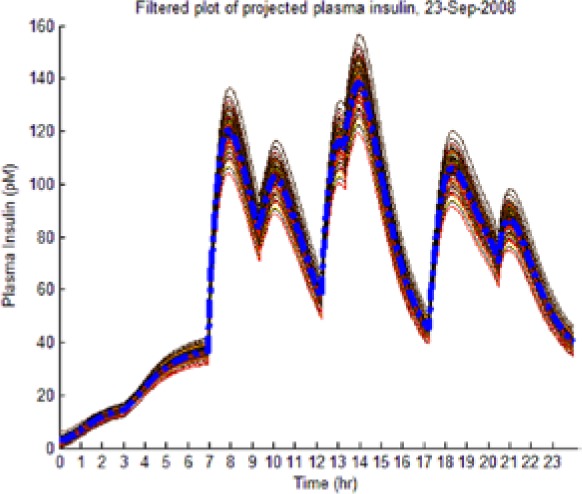 |
| S2 (No I) (September 23) | 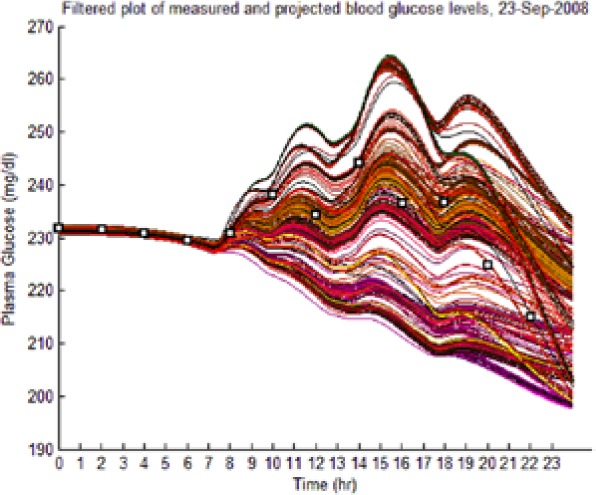 |
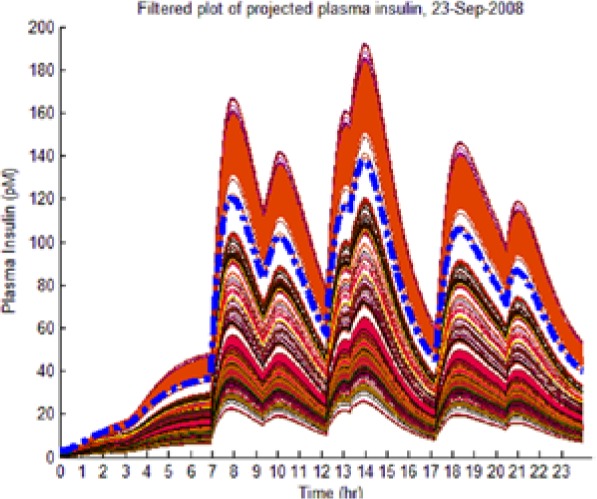 |
(Left) The reduced dynamic envelope generated from fasting data, with extraneous trajectories removed, shown for blood glucose (BG) (mg/dL) for September 23 with actual measurements superimposed (squares). Note that it enclosed the actual BG dynamics. (Right) Projected plasma insulin (PI) (pM), with actual PI shown (dashed blue line): (I) scenarios achieved prediction of blood insulin from fasting partial information, while (No I) scenarios predicted PI waveform as a function of underdetermined amplitude. (I), scenario where PI assays are available in stage 1 identification; (No I), scenario where PI assays are unavailable.
