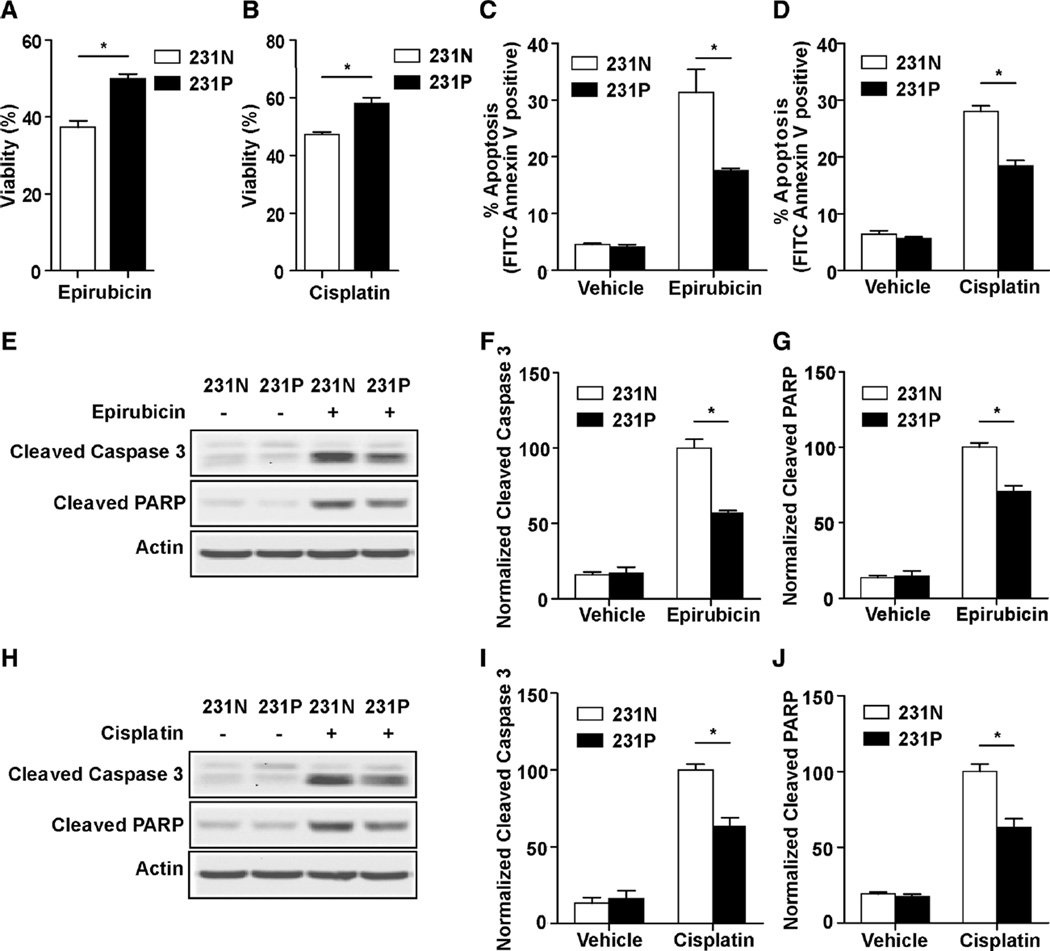
Fig. 5.
231P cells show cross-resistance to epirubicin and cisplatin. a and b Cell viabilities after 24 h of 25 µM epirubicin (a) or 5 µM cisplatin (b) treatment compared with vehicle in 231N and 231P cells by Trypan blue viability assay (Mean ± SE are shown, n = 3). *p < 0.05. c and d Cell apoptosis after 24 h 25 µM epirubicin (c) or 5 µM cisplatin (d) treatment compared with vehicle in 231N and 231P cells by Annexin V assay (Mean ± SE are shown, n = 3). *p < 0.05. e–j Expression of proapoptotic markers were analyzed after 24 h of 25 µM epirubicin (e–g) or 5 µM cisplatin (h–j) treatment compared with vehicle in 231N and 231P cells by Western blot. Representative results are shown in (e and h). Intensity of the protein bands were determined from three independent experiments by densitometry. Mean ± SE of the relative protein level (normalized to actin) are shown in (f and g), and (i and j), respectively. *p < 0.05

