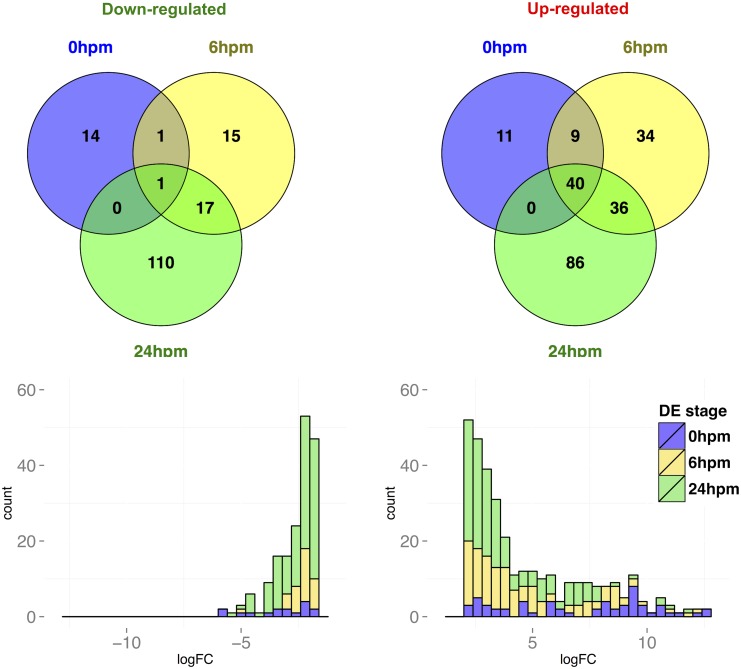
Fig 1. Transcripts that are significantly differentially expressed after mating.
(A) Venn diagram showing the number of down-regulated (left) and up-regulated (right) transcripts across the three post-mating time points. The up- and down-regulated gene counts are not mutually exclusive, such that transcripts that are both significantly up- and down-regulated are counted in both sets. (B) Histogram of log2 fold-change for transcripts with 2-fold or higher difference in abundance between virgin and post-mating samples (divided into 0.5 log2 bins). Each bin is partitioned into the time-point in which differential expression is detected (DE stage). The histograms are cumulative, such that transcripts that are differentially expressed in multiple time-points are represented multiple times.

