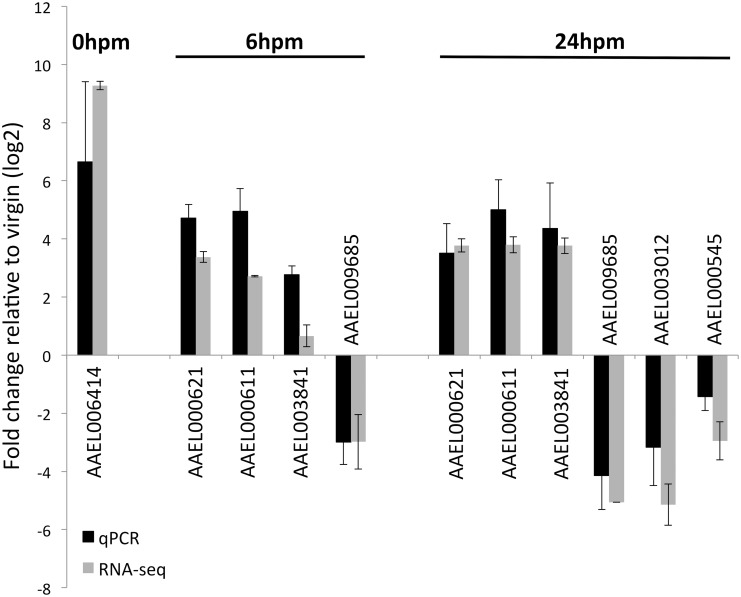
Fig 2. Expression patterns of seven genes using quantitative RT-PCR.
Each sample was obtained from the female reproductive tract minus the ovaries at different time points after mating. Each sample represents three different biological replicates, two of them using the expression of the gene RpS17 for normalization and a third using actin expression. Black bars show the results of the quantitative PCR and gray bars show the results of the RNAseq data. Error bars represent standard deviation. A Pearson correlation coefficient shows a positive correlation between qRT-PCR and RNAseq results (R2 = 0.912, p-value = 4.88E-6).

