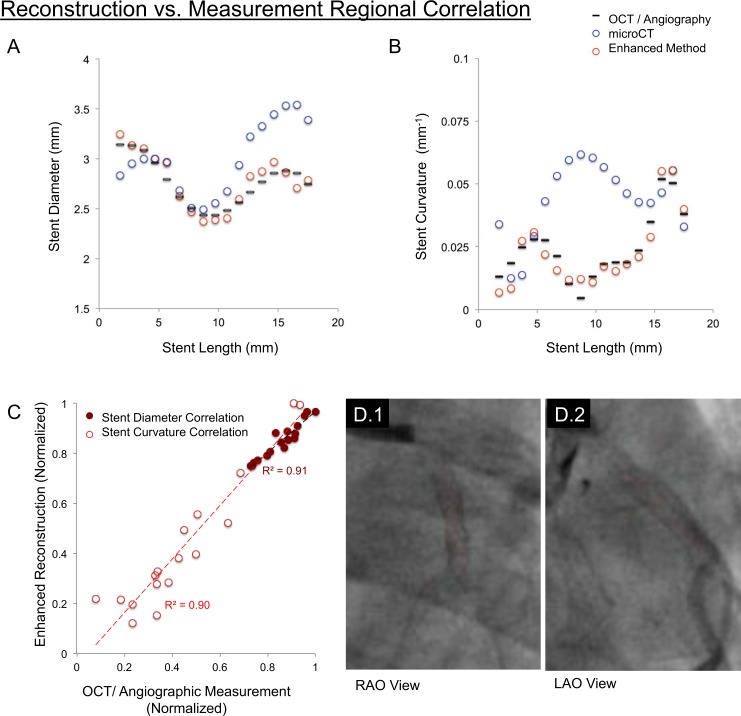
Fig 4. Discrete sampling of continuous enhanced reconstruction geometries facilitated comparison with OCT measurements.
Enhanced reconstruction (red circles) aligned closely with OCT/angiographic measurements (black lines), demonstrated for both (A) stent diameter; and (B) curvature. (C) Quantitatively, these shape parameters correlated strongly (r2 = 0.91 and 0.90, respectively) demonstrating recovery of implant shape at both local and regional scales. In contrast, mid-stent curvature on microCT measurements diverged (blue circles; in Fig 4B). (D.1,2). Planar angiography views with the centerline (red) superimposed through the stent demonstrate the relative straightness of the stent mid-region, suggesting microCT divergence was attributable to deformations of vessel geometry introduced upon explantation and processing.

