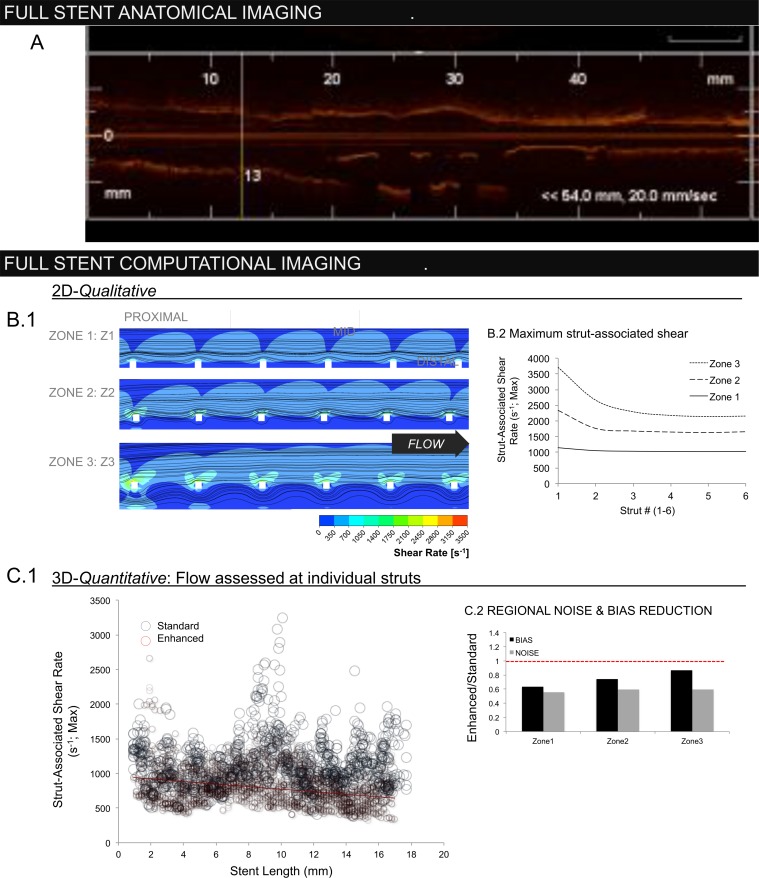
Fig 7.
(A) Lateral OCT frame demonstrating regional variations in the stented vessel (direct output from OCT console). (B.1) 2D flow reconstructions demonstrating the qualitative impact of strut-wall displacement (WD) as a function of lateral position along the stent length. (B.2) Largest flow disruptions occur in proximal struts with highest WD (zone 3), diminishing distally as upstream struts create a flow barrier. (C) While the enhanced method (red circles) was able to recover this regional trend, as demonstrated by negative correlation between maximum strut-associated shear rate and position along the stent length (slope = -18.5mm-1s-1; r2 = 0.09), absent with the standard method (blue) (slope = 1.4 mm-1s-1, r2 = 0.0003). Loss of inter-strut interactions due to discontinuous stent geometries generated by the standard method resulted in systematic overestimation of shear rate.

