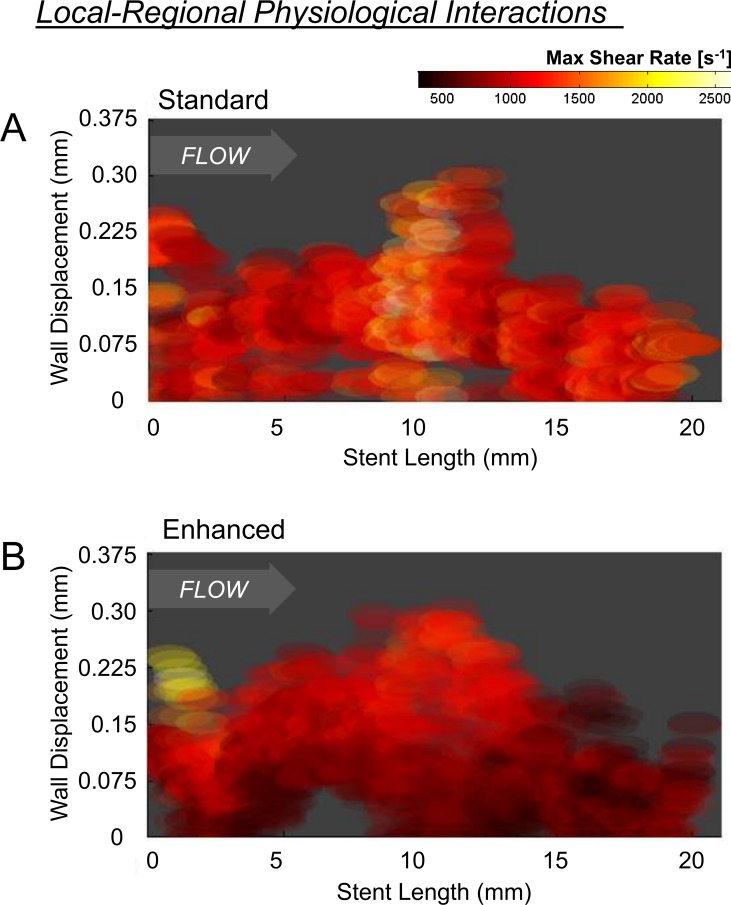
Fig 8. Depicted is the maximum strut-associated shear rate as a function of strut position relative to radial wall displacement (y-axis) and axial location in the stent (x-axis; from proximal to distal).
(A) Stent-level organization in shear rate was largely absent in the standard method, as demonstrated by the relatively homogenized nature of shear stress patterns across the stent. (B) This is in contrast to flow simulation performed using the enhance reconstruction method, were organized and more graded flow patterns were observed at both local (WD; y-axis) and regional (stent-length; x-axis) levels as shear stress smoothly transitioned from the proximal to distal end of the stent.

