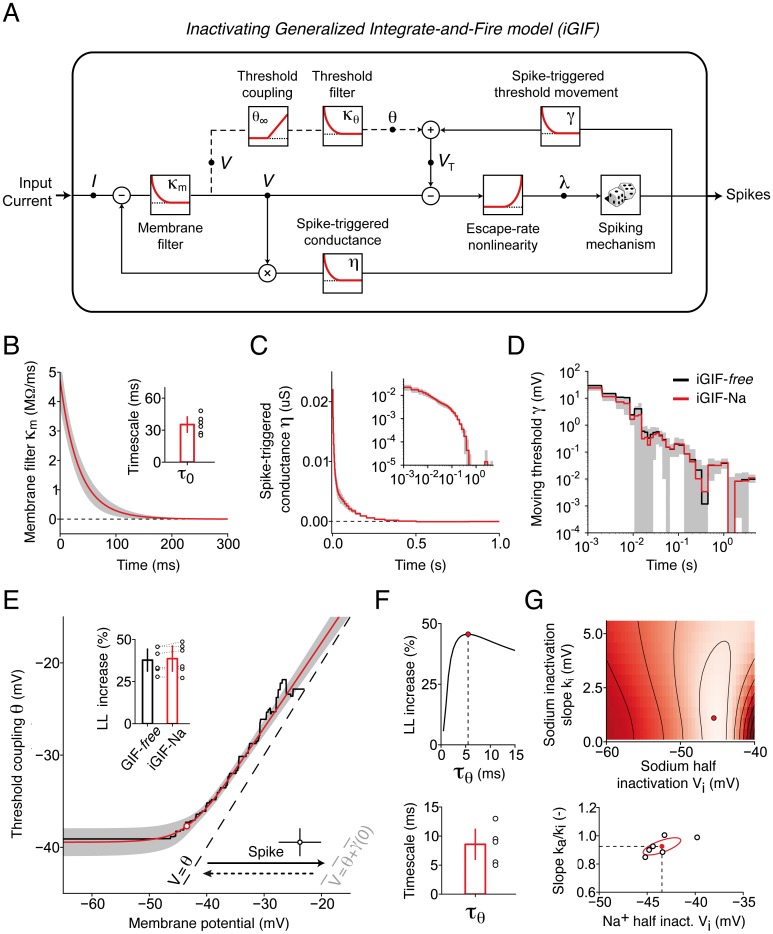
Fig 4. iGIF model with parameters extracted from intracellular recordings.
(A) Schematic representation of the iGIF model. The input current is first low-pass filtered by the Passive membrane filter . The resulting signal models the subthreshold membrane potential V(t) and, after subtraction of the firing threshold VT(t), is transformed into a firing intensity λ(t) by the exponential Escape-rate nonlinearity. Spikes are emitted stochastically and elicit both a Spike-triggered conductance η(t) and a Spike-triggered threshold movement γ(t). In the iGIF model, but not in the GIF model, the firing threshold VT(t) is coupled to the subthreshold membrane potential (dashed circuit). For that, the membrane potential V(t) is first passed through the nonlinear Threshold coupling function θ∞(V) and then low-pass filtered by the Threshold filter . (B)-(E) Average parameters extracted from 6 Pyr neurons. Black: iGIF-free, red: iGIF-Na. Gray areas indicate one standard deviation across cells for the iGIF-Na model. (B) Passive membrane filter κm(t). Inset: passive membrane timescale τm. Open circles: results from individual cells. Bar plot: mean and standard deviation. (C) Spike-triggered conductance η(t). Inset: same data on log-log scales. (D) Spike-triggered threshold movement γ(t). (E) Nonlinear threshold coupling θ∞(V) (iGIF-free, solid black line; iGIF-Na, solid red line). Spikes are emitted stochastically when the spiking boundary V = VT is approached. This boundary defines the line where the probability p of emitting a spike during a time bin of ΔT = 0.1 ms reaches p = 0.63. To the right, the probability increases further. In the absence of previous action potentials, the spiking boundary is given by V = θ (dashed black). After an action potential, the spiking boundary instantaneously shifts to the right by γ(0)≈25 mV (dashed gray), and then slowly decays back to V = θ. After each spike, the variables (V(t), θ(t)) are reset to (open circle; error bars denote one standard deviation across cells). The open red circle indicates the Na+ half-inactivation voltage Vi, where the threshold becomes sensitive to the membrane potential. Inset: percentage increase in model log-likelihood (LL) of iGIF models with respect to the GIF model. Open circles: model performance on the same cell for iGIF-free and iGIF-Na. Bar plots: mean and standard deviation across neurons. (F) Top: LL percentage increase of the iGIF-free model as a function of τθ. Red circle: optimal timescale τθ. Data are shown from a typical neuron. Bottom: optimal timescales τθ extracted from 6 Pyr neurons. (G) Top: LL percentage increase of the iGIF-Na model as a function of ki and Vi. The LL increases from dark to light red. Red circle: optimal parameters. Bottom: optimal parameters extracted from 6 different Pyr neurons. Note that the half-inactivation voltages Vi reported in the figure are positively biased due to uncompensated liquid junction potential of 14.5 mV (see Materials and Methods). The mean and the standard deviational ellipse across cells are shown in red.

