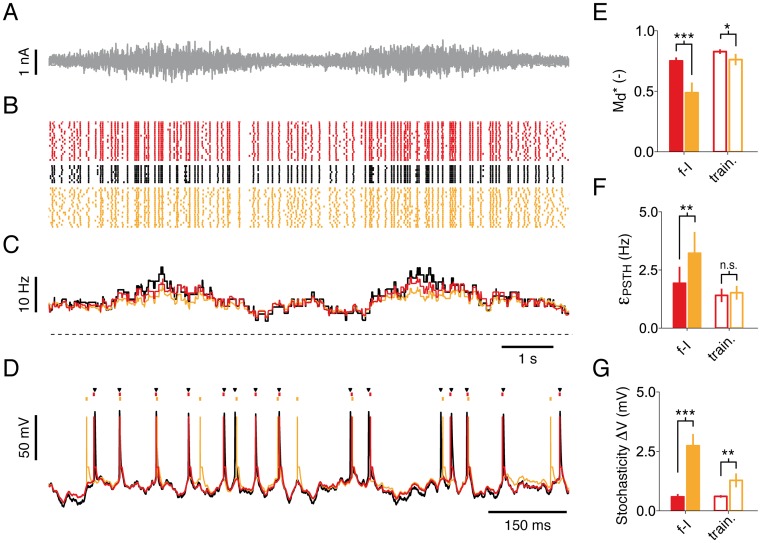
Fig 6. The iGIF model predicts spikes with millisecond precision.
(A) Segment of the 20-second current used in the test dataset. (B) Spiking response of a Pyr neuron (black) to 9 repetitive injections of the current shown in panel A. The predictions of the iGIF and GIF model are shown in red and yellow, respectively. (C) PSTHs computed by filtering the spike trains shown in panel B with a 500 ms rectangular window. The dashed line indicates 0 Hz. (D) Typical intracellular response (black), as well as typical iGIF (red) and GIF (yellow) model prediction, to a single presentation of a 1-s segment of the current shown in panel A. Black triangles and colored dots indicate spikes. (E)–(G) Summary data showing the performance of the iGIF (red) and the GIF (yellow) model in predicting the test dataset. Filled bars and open bars show the performance of models trained on the f–I dataset and the training dataset, respectively. Error bars represent one standard deviation across neurons. (E) Spike-timing prediction as quantified by the similarity measure . The iGIF model significantly outperforms the GIF model with parameters extracted from the f–I dataset (, s.d. 0.03, iGIF; , s.d. 0.08, GIF; n = 6, paired Student t-test, t5 = −8.44, p = 3.8 · 10−4) and from the training dataset (, s.d. 0.02, iGIF; , s.d. 0.05, GIF; n = 6, paired Student t-test, t5 = −3.25, p = 0.022). (F) The prediction error ϵPSTH on the PSTH (see panel C) was quantified by computing the root mean square error between data and model prediction. The iGIF model significantly outperforms the GIF model with parameters extracted from the f–I dataset (ϵPSTH = 1.93, s.d. 0.71 Hz, iGIF; ϵPSTH = 3.22, s.d. 0.91 Hz, GIF; n = 6, paired Student t-test, t5 = 6.33, p = 1.5 · 10−3) but not when the parameters are extracted from the training dataset (ϵPSTH = 1.41, s.d. 0.28 Hz, iGIF; ϵPSTH = 1.52, s.d. 0.30 Hz, GIF; n = 6, paired Student t-test, t5 = 0.95, p = 0.38). (G) Comparison between GIF the iGIF model stochasticity. The iGIF model is significantly less stochastic than the GIF model (ΔV = 0.59, s.d. 0.12 mV, iGIF; ΔV = 2.74, s.d. 0.50 mV, GIF; n = 6, paired Student t-test, t5 = 9.68, p = 2.0 · 10−4, f–I dataset; ΔV = 0.60, s.d. 0.05 mV, iGIF; ΔV = 1.28, s.d. 0.29 mV, GIF; n = 6, paired Student t-test, t5 = 5.71, p = 2.3 · 10−3, training dataset).

