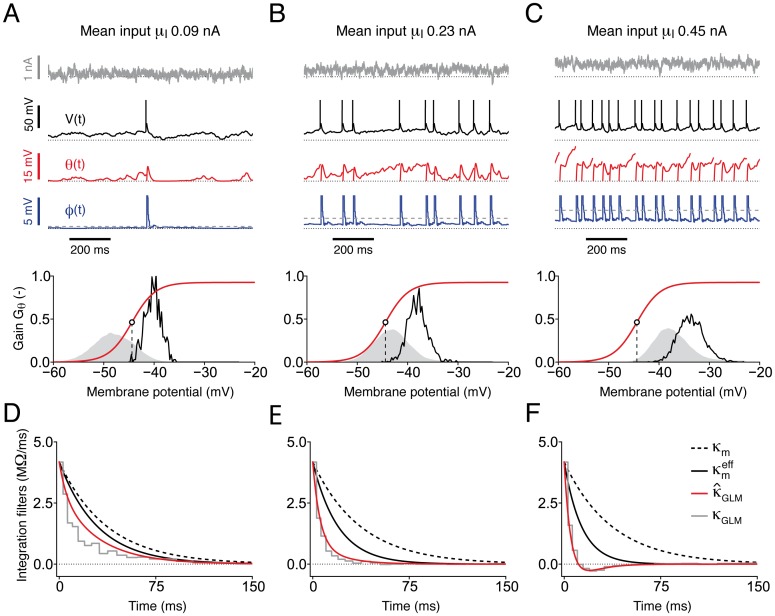
Fig 7. The threshold-voltage coupling progressively activates with increasing input strengths μI.
Dynamics of the iGIF model (with parameters extracted from a typical Pyr neuron) responding to three fluctuating currents with standard deviation σI = 100 pA, temporal correlation τI = 3 ms and μI = 90 pA (panels A and D), μI = 230 pA (panels B and E) and μI = 450 pA (panels C and F). (A) Top: input current I(t) (gray), membrane potential V(t) (black), voltage-dependent threshold adaptation θ(t) (red) and spike-dependent threshold adaptation (blue) as a function of time. The four dotted lines indicate: I = 0 nA, V = EL, and φ = 0 mV. Bottom: distribution of subthreshold membrane potential fluctuations P(V) (gray) and of voltages at which spikes were initiated P(V|spike) (black). The instantaneous threshold-coupling gain (red) defines the sensitivity of the firing threshold to the membrane potential and can be interpreted as an activation function for the threshold-voltage coupling. Since is a nonlinear function of V, Gθ depends on the membrane potential. For low inputs, the histogram of voltage s P(V) covers mostly the region V ≤ Vi (dashed horizontal line), where the threshold-voltage coupling is not active. (B) Same results as in panel A obtained by increasing the mean input μI. With medium input strength, the majority of the voltage distribution lies in the region V ≈ Vi, where the threshold-voltage coupling is active. (C) As in panel B, but for strong mean input μI. In this case, the voltage-threshold coupling is almost always active (i.e., V ≥ Vi). (D) The GLM integration filter κGLM(t) (solid gray) obtained by fitting a GLM to the spiking activity of the iGIF model (panel A) is compared against the passive membrane filter κm(t) (dashed black, see Fig 4B) and the effective membrane filter (solid black), which accounts for the conductance increase mediated by η. The GLM integration filter κGLM(t) (solid gray) matches the theoretical filter (solid red; see Eq 7), which takes into account the effect of the threshold-voltage coupling. (E)-(F) Same plots as in panel D, but for increased mean input μI.

