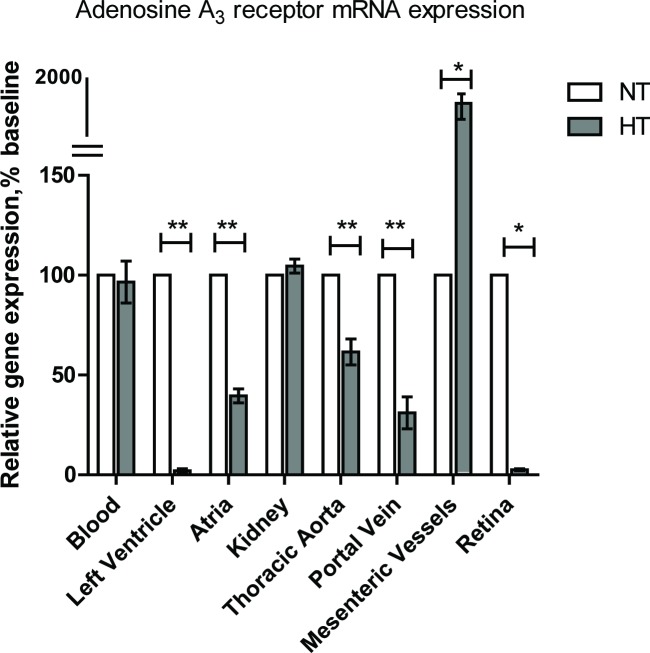
Fig 1. Relative mRNA expression of adenosine A3 receptor in a range of cardiovascular tissues.
The 2-ΔΔCt method was used to calculate relative mRNA expression. A Student’s t test was then performed as compared spontaneously hypertensive rat group (HT) with normotensive group (NT), (n = 8 for each group). Data were presented in mean±SEM. Three independent experiments were performed in duplicates. *p<0.05, **p<0.0005.

