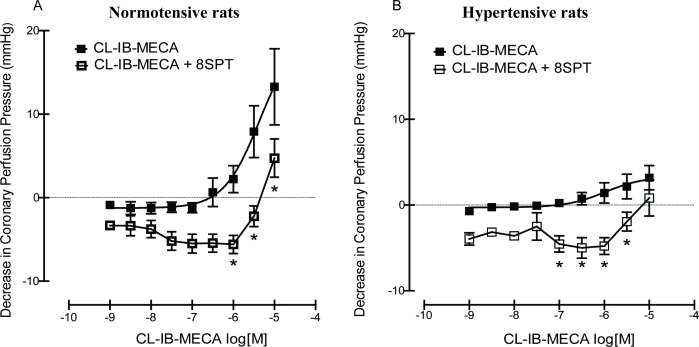
Fig 3.
Concentration response curve showing the effects of CL-IB-MECA in the absence and presence of 8SPT (10-5M) in (A) normotensive rats and (B) spontaneously hypertensive rats. Concentration response curves to CL-IB-MECA were analysed using nonlinear regression, from which EC50 values and 95% confidence intervals were also derived. One-way or two-way ANOVA were performed on the data, followed by Tukey’s Multiple Comparison Test/Bonferroni for individual comparisons when significant effects were detected. *denotes statistical significance (p<0.05) compared to absence of antagonist group.

