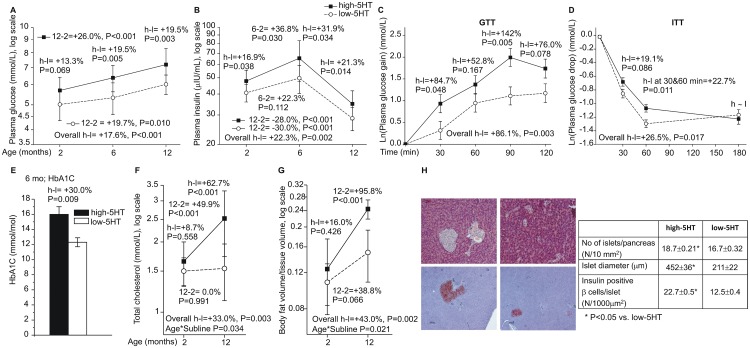
Fig 5. Development of glucose and lipid metabolism alterations with age in high-5HT and low-5HT rats.
A-B. Plasma glucose and insulin levels (mean±SD, n = 7–24). C-D. Glucose metabolism functional tests in 6 months old animals. Data are least square mean±SE gain (GTT) or drop (ITT) in glucose levels (n = 8–10). E. Plasma HbA1c in 6 months old rats (mean±SD, n = 3). F-G. Indicators of lipid metabolism in 2 and 12 months old rats (mean±SD, n = 6–10). H. Pancreatic beta islet analysis in high-5HT and low-5HT rats (n = 6). Depicted are relative differences (%): for the overall difference between the high-5HT and low-5HT sublines (h-l), and for subline*age interaction (indicated only where significant), P<0.05 is considered significant; for contrasts between sublines at a given age (or time in GTT/ITT), and between different ages within the given subline, P<0.025 is considered significant. Analysis of GTT and ITT data was adjusted for baseline glucose levels. GTT- glucose tolerance test; ITT—insulin tolerance test.

