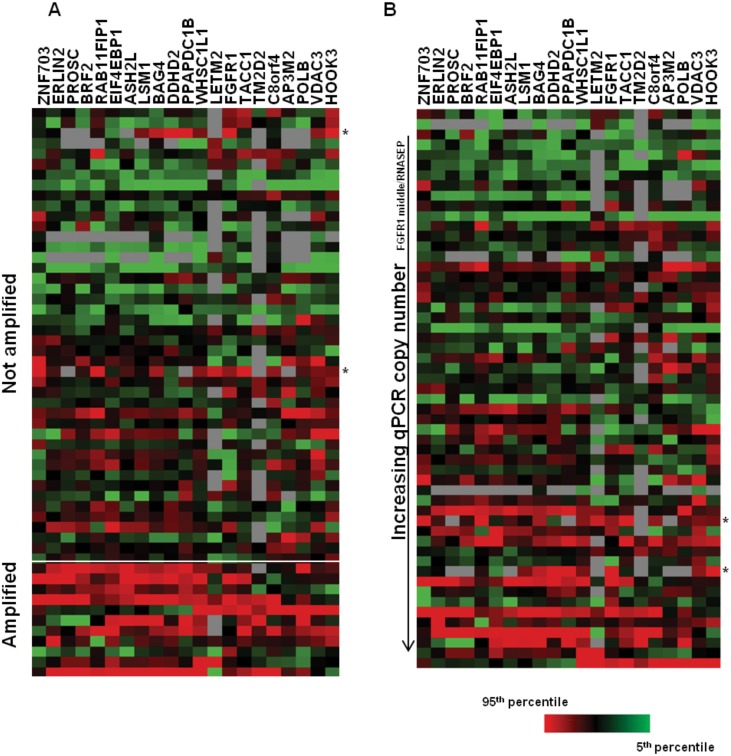
Fig 4. Gene expression profiles of 8p amplicon genes in sqNSCLC tissues.
A) Heatmap reflecting nanoString gene expression profiles of FGFR1 amplified and non-amplified sqNSCLC tissues as determined by FISH. * indicates non-amplified samples which had gene expression profiles similar to those of the amplified samples. B) Heatmap reflecting nanoString gene expression profiles of sqNSCLC ranked by increasing FGFR1 inferred gene copy number as determined by qPCR. * indicates the same samples identified in A. red: 95th percentile, green: 5th percentile; grey: not detected.

