
Fig. 2. ACRs do not conduct cations.
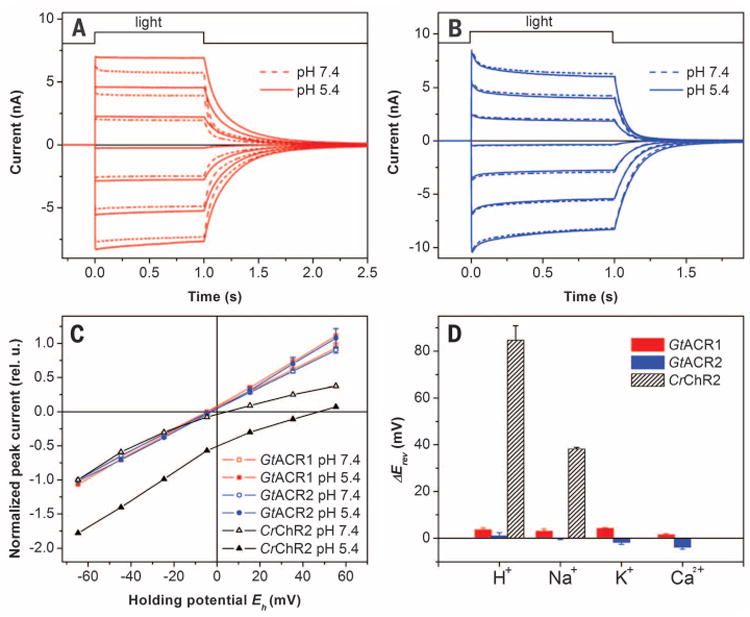
Photocurrents generated by GtACR1 (A) and GtACR2 (B) in HEK293 cells at the membrane potentials changed in 20-mV steps from −60 mV at the amplifier output (bottom to top). The pipette solution was standard, and the bath solution was as indicated. (C) IE relationships measured at various pH of the bath. The data (mean values ± SEM, n = 4 to 6 cells) were corrected for liquid junction potentials (table S1) and normalized to the value measured at −60 mV at pH 7.4. Representative data for CrChR2 are shown for comparison. (D) Erev shifts measured upon variation of the cation composition of the bath. The data are mean values ± SEM (n = 3 to 6 cells).