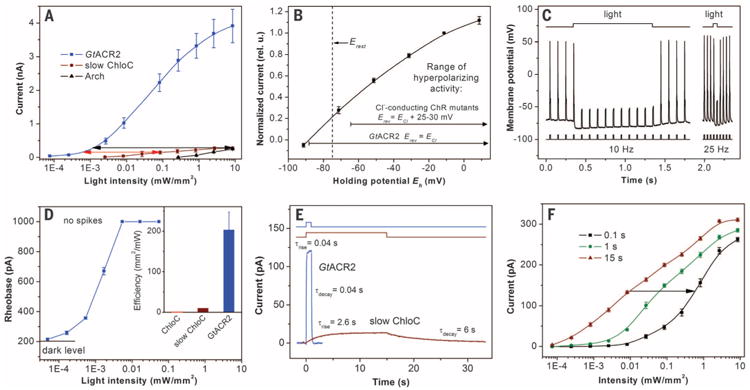
Fig. 4. GtACR2 as a hyperpolarizing tool.

(A) Light-intensity dependence of photocurrents generated by GtACR2, slow ChloC, and Arch in HEK293 cells at 20 mV. The arrows show the difference in light sensitivity. (B) IE relationship for GtACR2 in neurons. The data (mean values ± SEM, n = 5 cells) were corrected for LJP (table S2). The dashed vertical line shows the resting potential (Erest). The ranges of activity for Cl−-conducting ChR mutants are from (14, 15). (C) Photoinhibition of spiking induced by pulsed current injection in a typical neuron expressing GtACR2. The light intensity was 0.026 mW/mm2. (D) The dependence of the rheobase of current ramp-evoked spikes on the light intensity in a typical neuron expressing GtACR2. The data are mean values ± SEM (n = 5 repetitions). Light was applied 0.1 s before the beginning of the current ramp. (Inset) Comparative efficiency of GtACR2 and the ChloC mutants represented as a reciprocal of the minimal light intensity sufficient to fully suppress spiking. The data for GtACR2 are the mean value ± SEM (n = 7 neurons). Data for the ChloC mutants under continuous illumination are from (14). (E) Kinetics of the photocurrents generated by GtACR2 in response to a 1-s light pulse and by slow ChloC in response to a 15-s light pulse (light intensity for both traces was 0.002 mW/mm2). The time constants (τ) were determined by single exponential fits of the recorded traces. The fitted curves are shown as thick lines of the same color as the data. (F) The light-intensity dependence of slow ChloC current amplitude measured at different times after the start of illumination. Data are mean values ± SEM (n = 5 cells). The arrow shows the increase in the light intensity necessary to reach the same current amplitude at 0.1 as at 15 s illumination.
