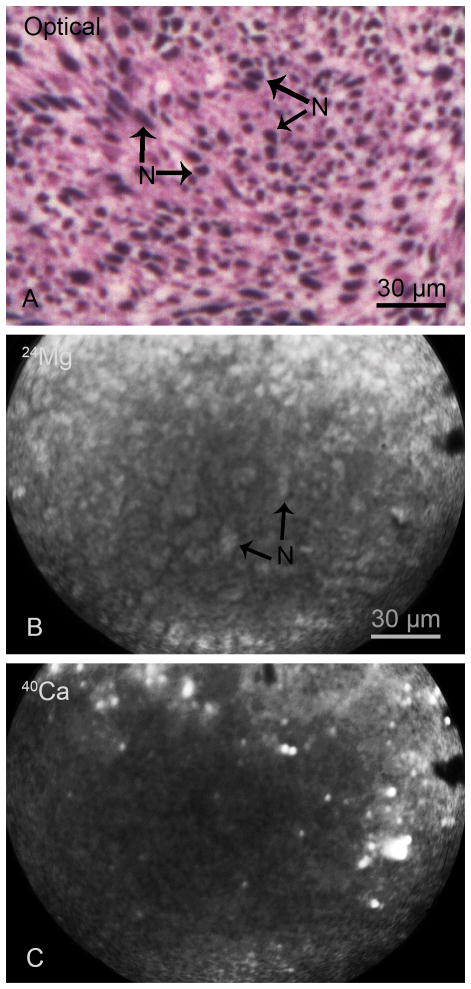
Fig. 1.
SIMS imaging of total Mg and Ca distributions in the main tumor mass of a F98 glioma bearing rat. The optical image of a H & E stained cryosection illustrates nuclei (N) of individual cells compacted in the tumor mass (A). The positive secondary ion SIMS images of 24Mg and 40Ca from an adjacent cryosection demonstrate the spatial distribution of total magnesium and calcium in the tumor mass (B, C). The image integration times on the CCD camera for SIMS images of 24Mg+ and 40Ca+ were 1 min and 2 min, respectively.

