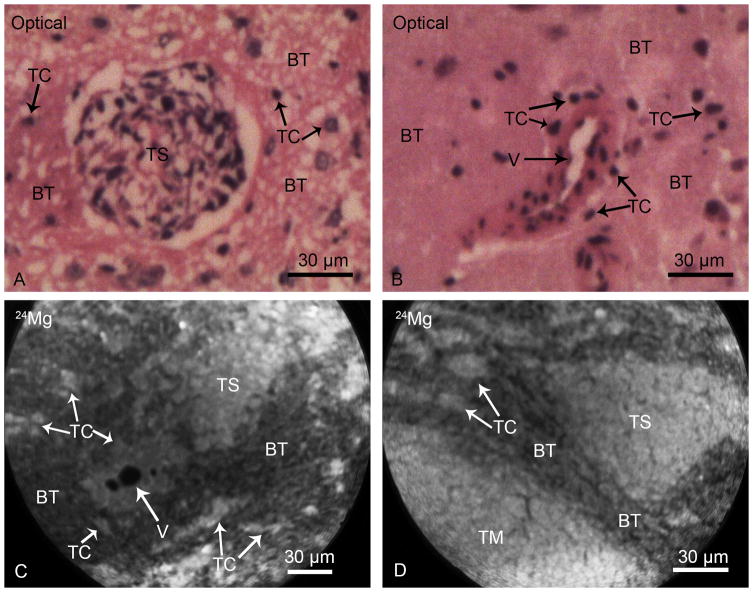
Fig. 3.
SIMS analyses of brain from F98 glioma bearing rats. Typical morphological features of infiltrating tumor cells (TC) and clusters of tumor cells, tumor satellites (TS), in the brain tissue (BT) are illustrated in optical images of H & E stained cryosections (Panels A & B). A vessel (V) is surrounded by infiltrating tumor cells in the brain tissue (Panel B). SIMS imaging analysis of 24Mg distributions from two different cryosections are shown in panels C and D. The tumor satellites (TS), infiltrating tumor cells (TC) and TC’s surrounding the vessel (V) reveal higher total magnesium concentrations in comparison to the surrounding brain tissue (BT). The 24Mg SIMS image, shown in the panel D, also illustrates a portion of the tumor mass (TM) alongside of a triangular tumor satellite region in the brain tissue with consistent observations of higher magnesium concentrations in tumor mass, tumor satellites, and individual infiltrating tumor cells in comparison to the brain tissue. The image integration times on the CCD camera for 24Mg+ SIMS images were 1 min each.

