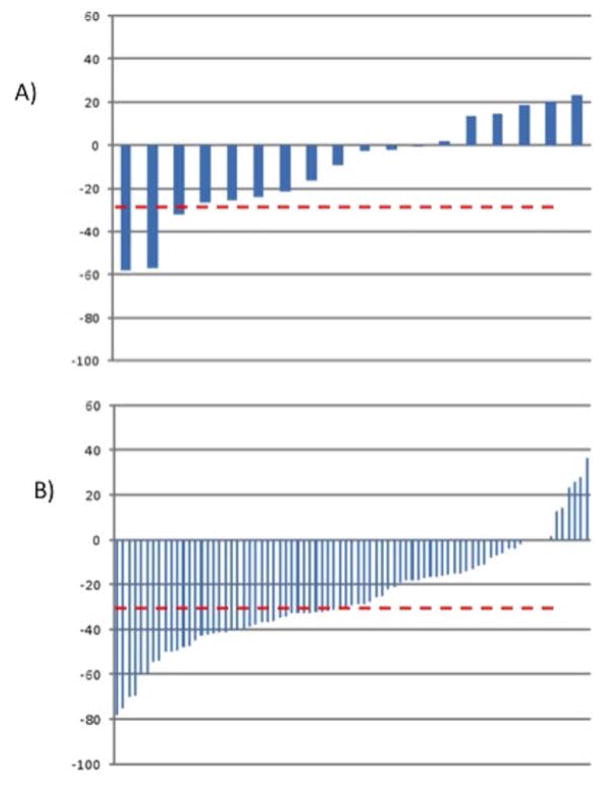
Figure 3.
Waterfall plots presenting the ranking of individual patients according to RECIST response to treatment. A) response with systemic chemotherapy (n=7 of 18 patients or 39%), B) response with HAI chemotherapy (n=47 of 79 or 59%) (p=0.11)
(y axis: % change in tumor diameter, red line 30% response)

