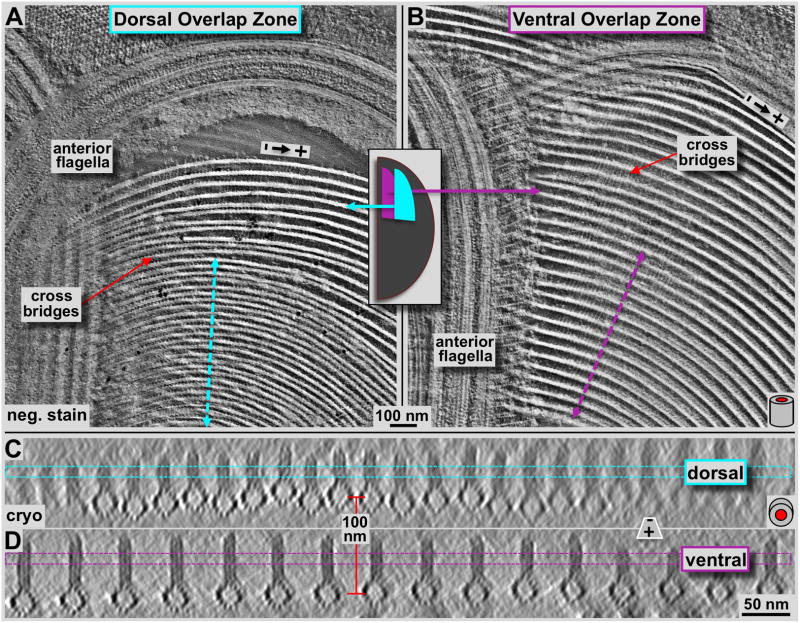
Figure 5. Tomographic 3-D analysis of the Giardia ventral disc overlap zone using negative staining tomography (A & B) and cryo-tomography (C & D).
Panels A and B show tomographic 4.7 nm thick xy-slices of negatively stained dorsal (A) and ventral (B) overlap zones. The overall orientation is analogous to figure 2 with the marginal plate near the top of the image, and the slice cuts through the microribbon part of the microtubule-microribbon complexes. The cyan (A) and pink (B) lines mark the positions of the corresponding frames in C and D, respectively. The lateral packing in the dorsal overlap zone is much tighter than in the ventral overlap zone. The tomographic xz-slices in C & D are taken from a cryo-electron tomogram of the overlap zone and represent an approximately 16 nm projection along the microtubule axis. Dorsal overlap zone (C) and ventral overlap zone slices (D) are from the same tomogram but slightly rotated towards each other as indicated by the arrows in A and B, to align each projection along the microtubule axes. This was not possible over the entire width of the picture. Hence, the fuzzy microtubule-microribbon complexes, particularly in C are not precisely aligned to the projection axis, but are equally well preserved. The distance between dorsal (C) and ventral microtubule layers (D) is according to that measured in the tomogram and varies between approximately 100–120 nm.

